Prepare Your Excel File
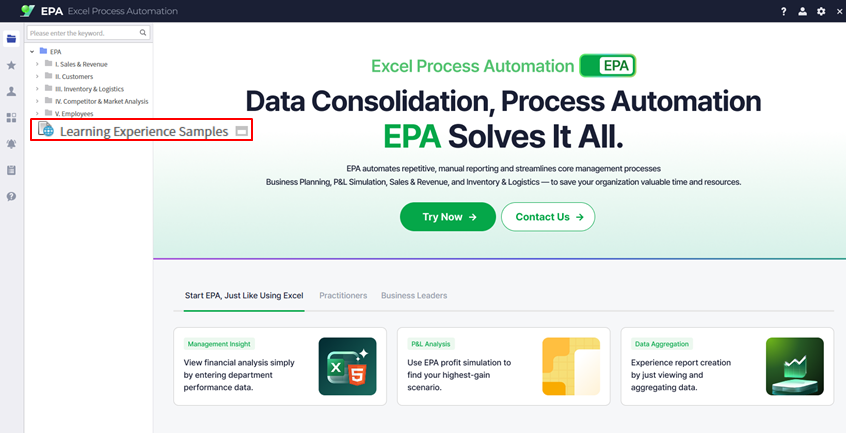
Download sample from Learning Experience Samples
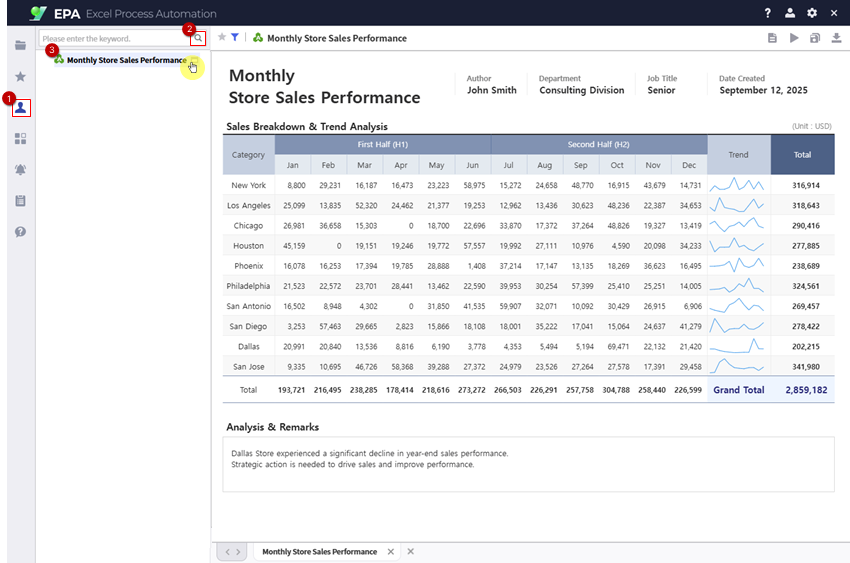
Download the monthly store sales performance sample file from the Learning Experience Samples section. This Excel file contains the template you will convert into a web report.
Tip: Simply update the Excel file later, and changes are automatically reflected in the web report.
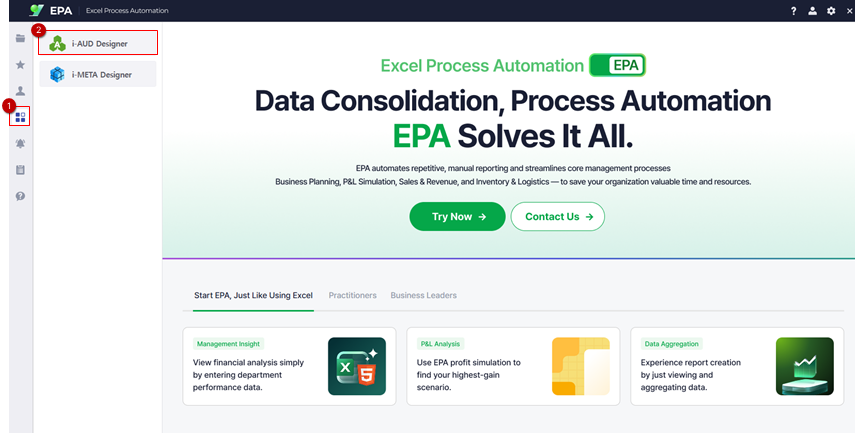
Launch i-AUD Designer
Open the design tool from the EPA main screen
Open the i-AUD Designer by navigating to [Menu] → [Tool]. This is where you will configure your Excel file for web conversion.
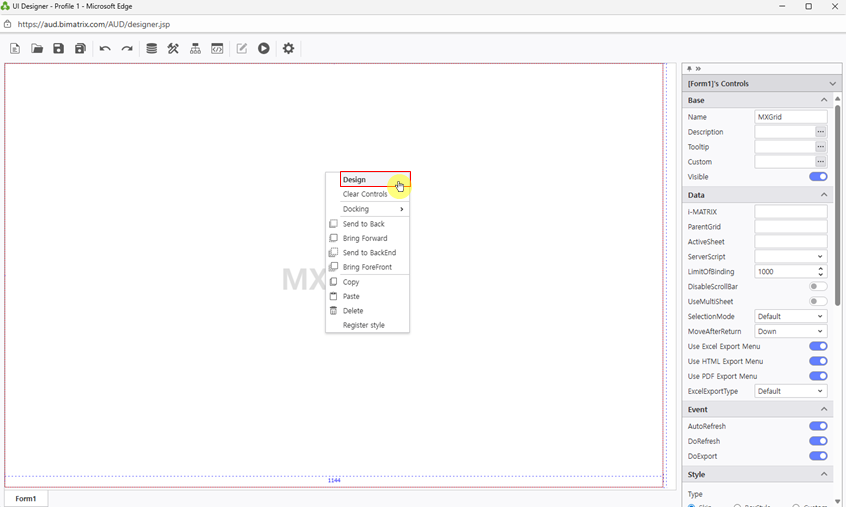
Connect Excel to MX-Grid
Place the grid component and load your Excel file
Select UI Bot > MX-Grid to place the grid component on the workspace.
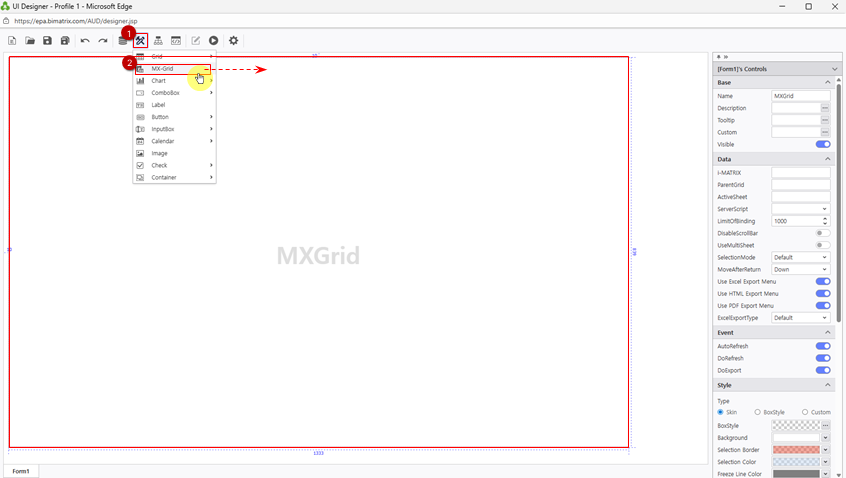
Right-click the component and choose Design to open the design mode.
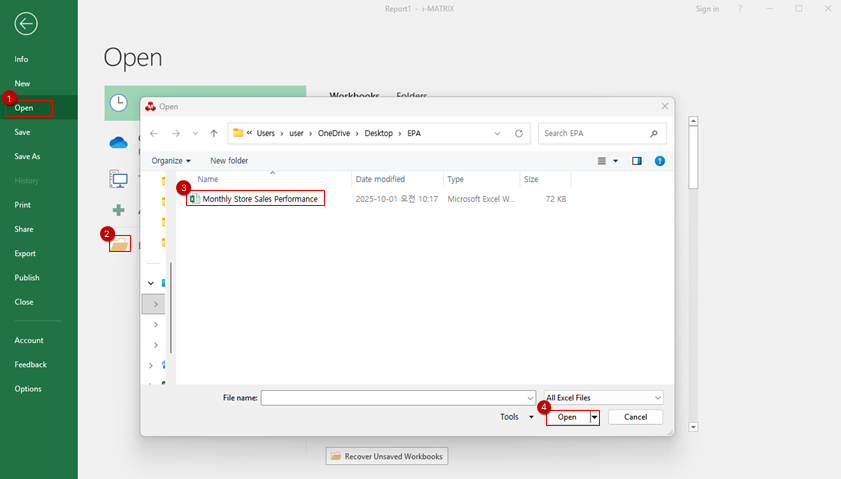
Use File > Open Excel to load your prepared Excel file.
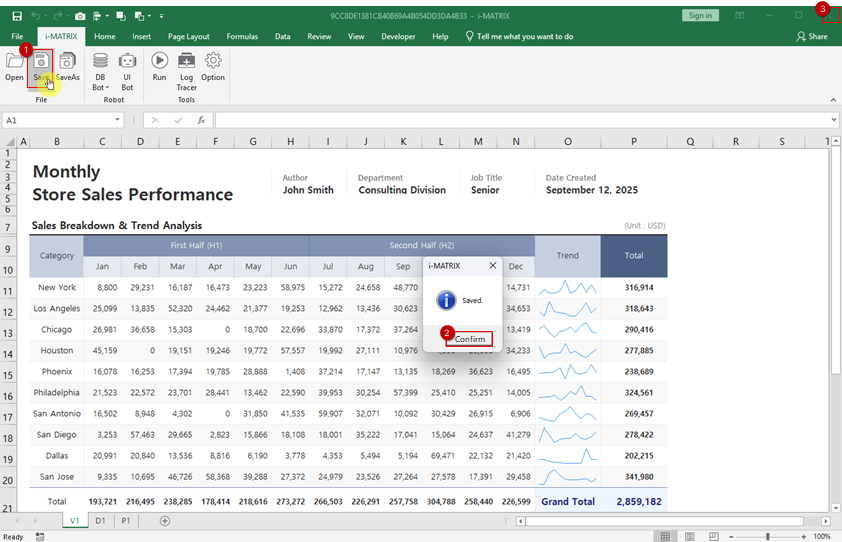
Click Save to apply the connection between Excel and the MX-Grid component.
View Report on Web
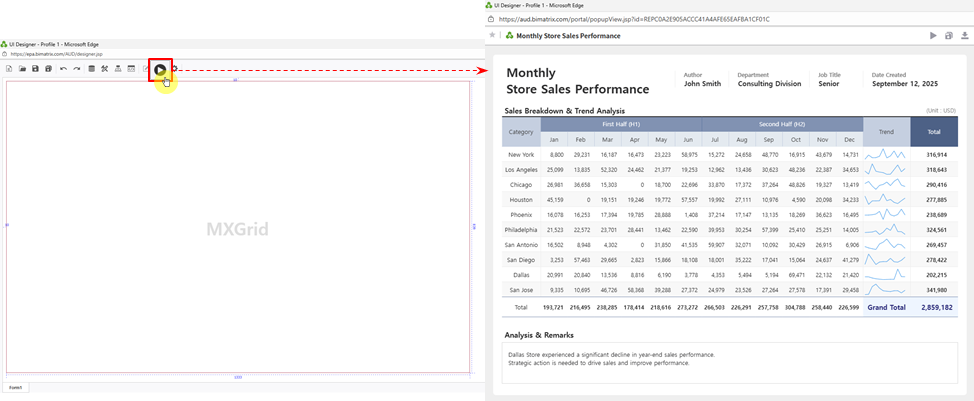
Click Execute button to preview your report
Click the Execute button to preview your converted report in the web browser. Verify that all data displays correctly and the layout matches your expectations.
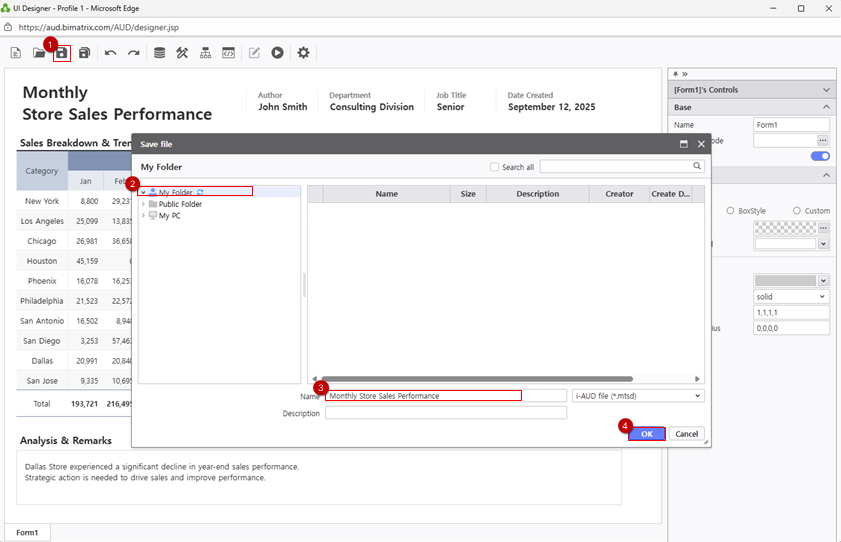
Save Your Report
Save to My Folder and verify your report is accessible
Save your completed report to My Folder.
Verify the report is accessible by navigating to [Menu] → [Individual]. Your report will be listed and ready to use.