Convert Excel to Web
Download sample, launch i-AUD Designer, and configure layout
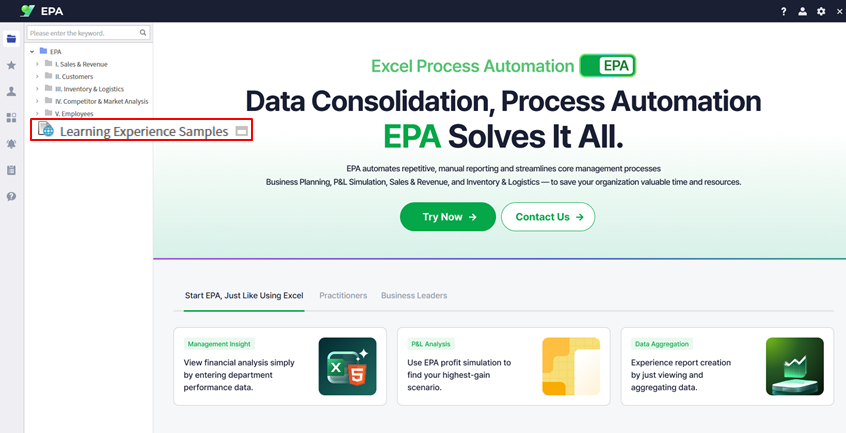
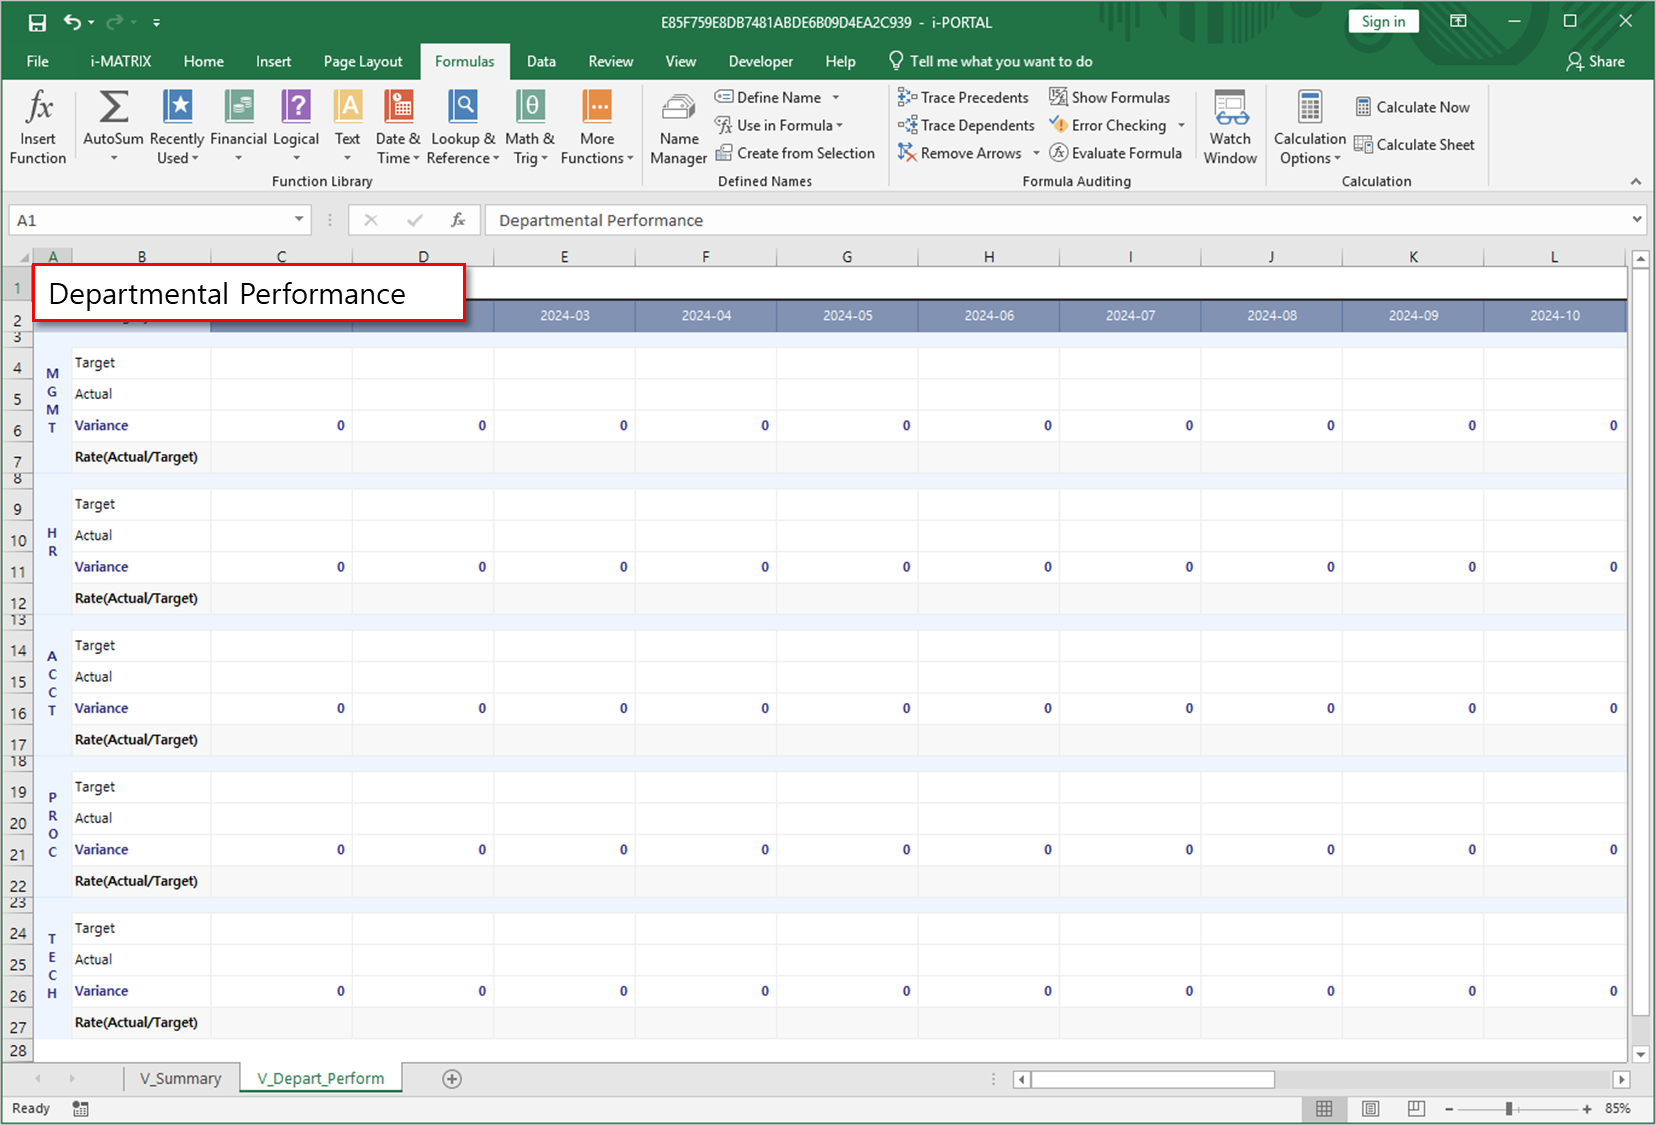
Download the departmental performance sample file from Learning Experience Samples.
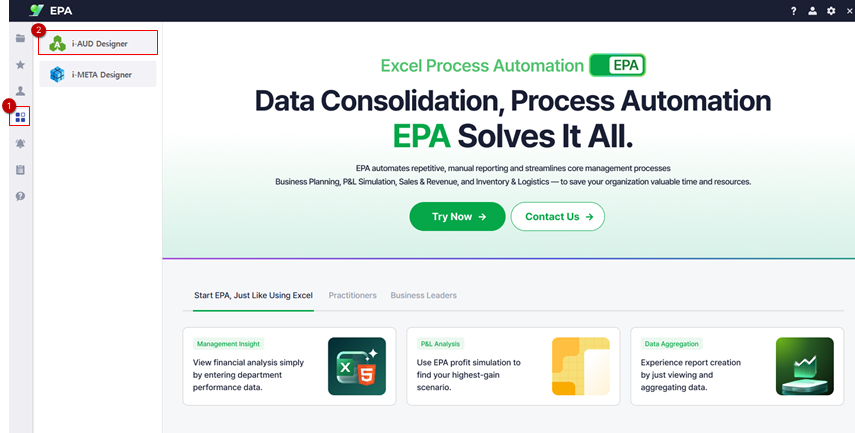
Launch i-AUD Designer from [Menu] → [Tool].
Drag & drop the downloaded Excel file into the i-AUD Designer workspace.
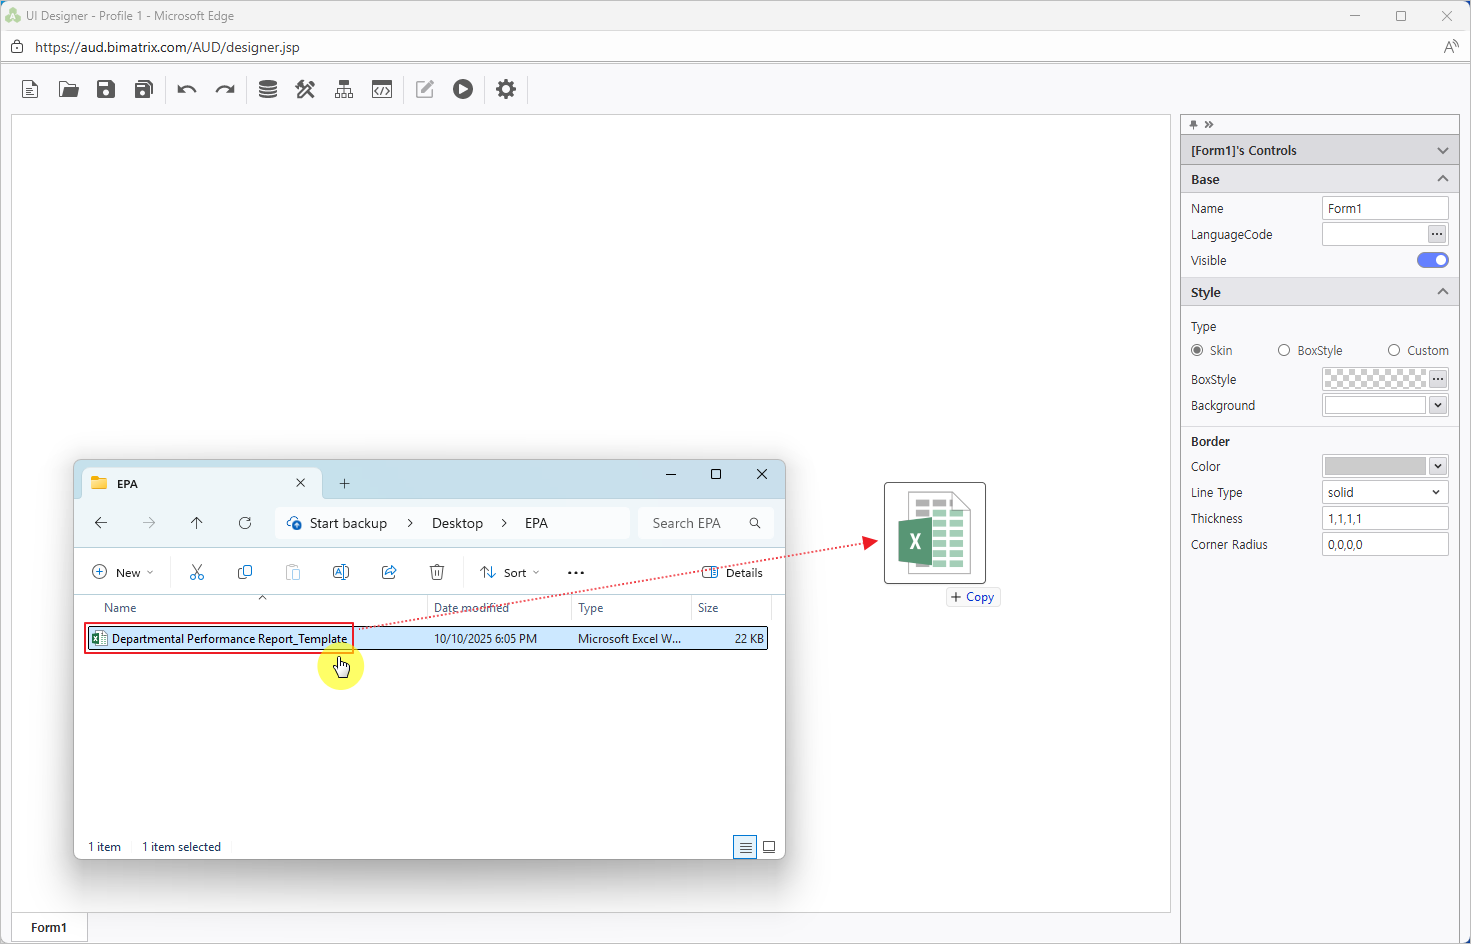
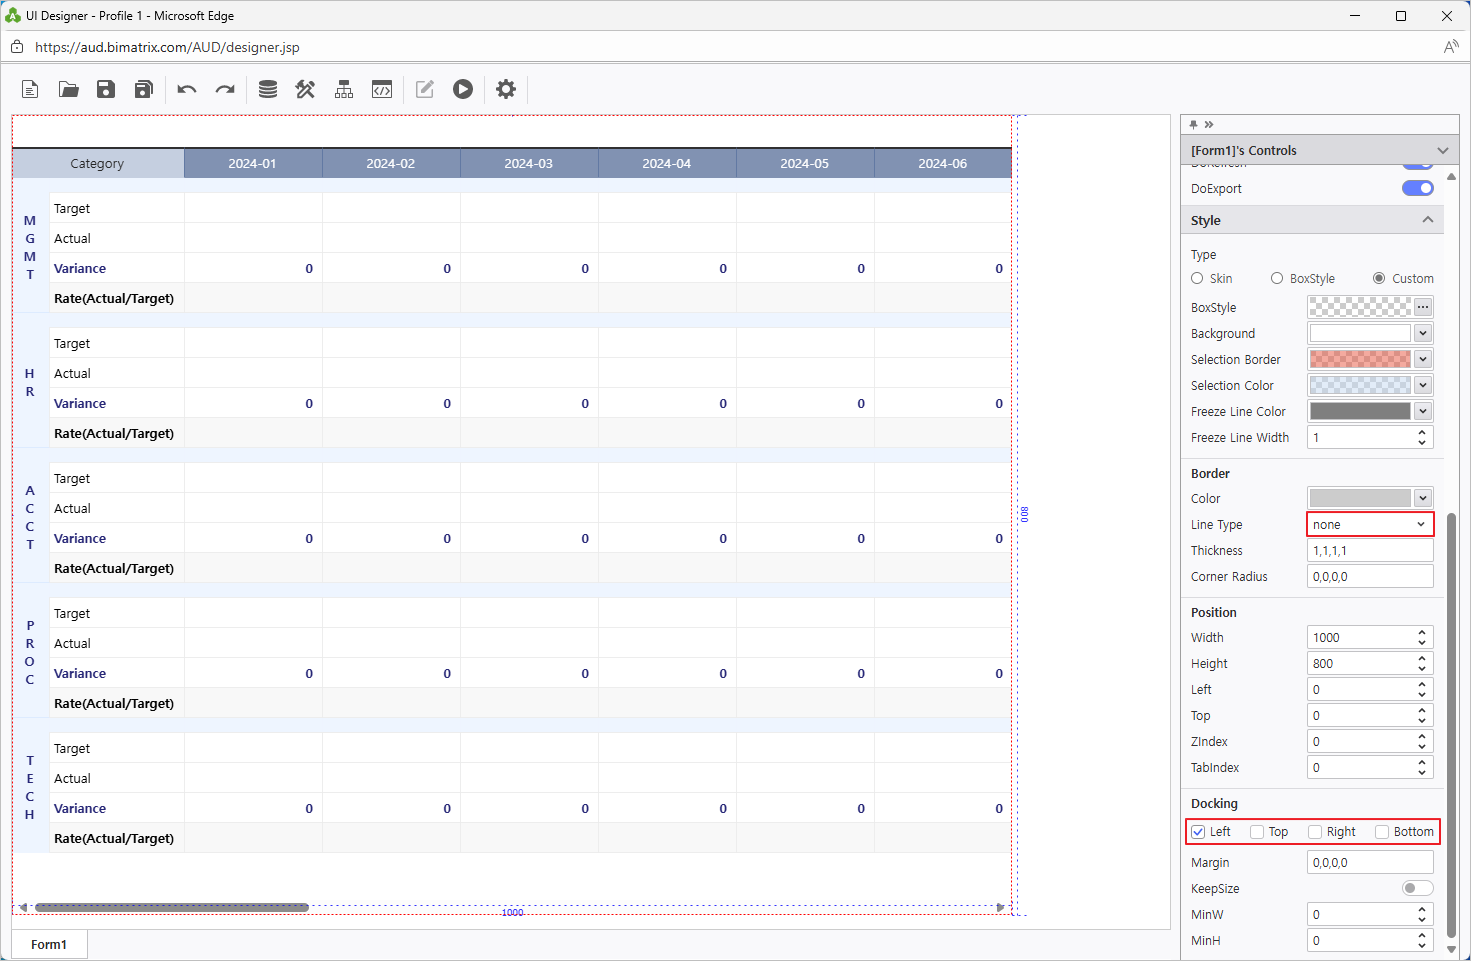
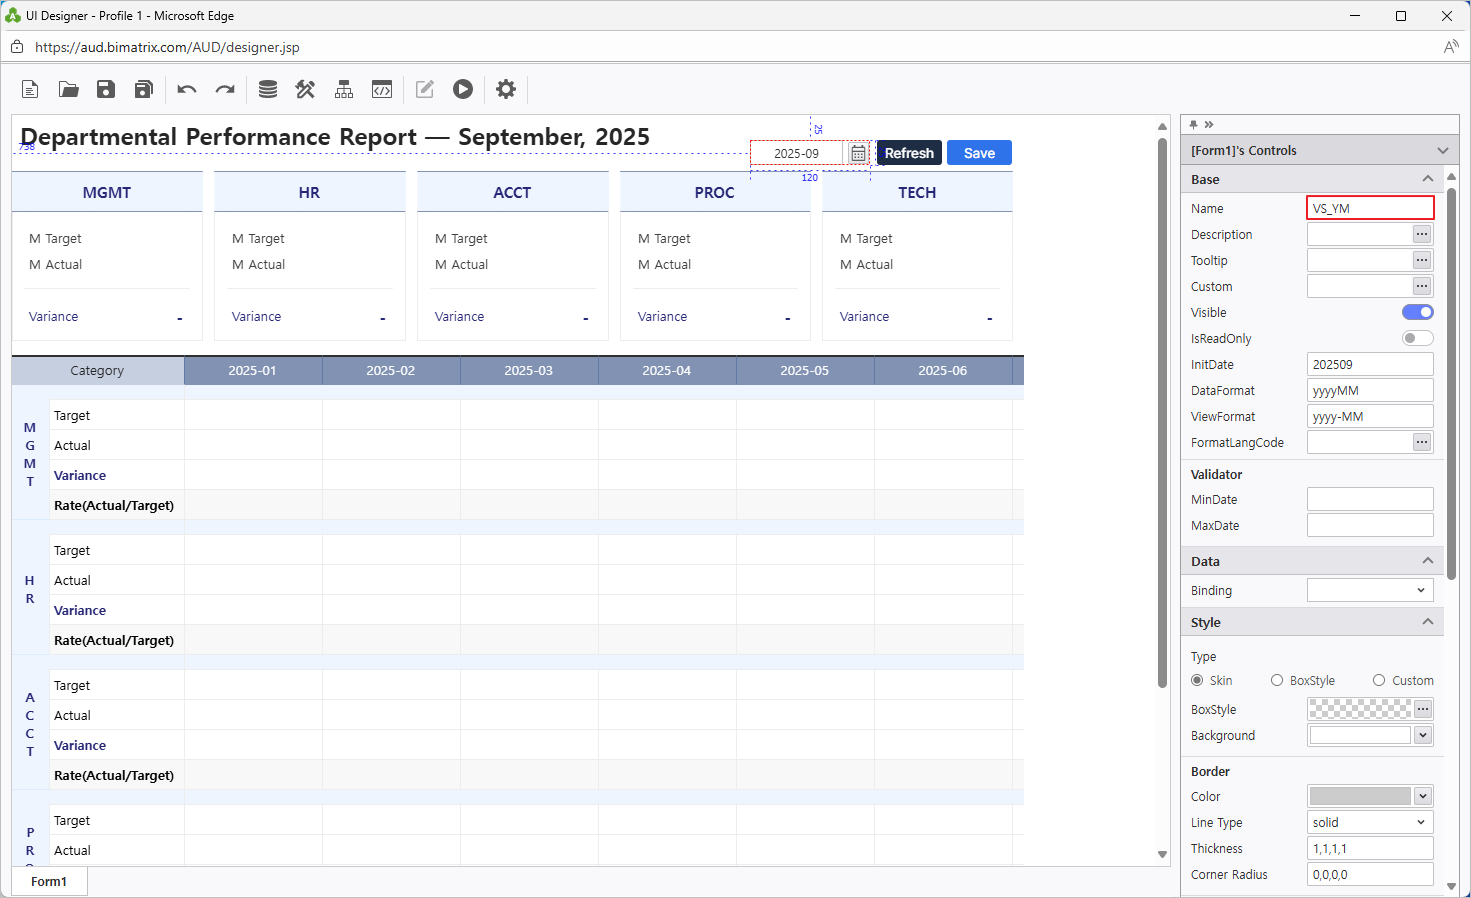
In the Properties pane, set the border Line Type to None for a clean layout.
Tip: Setting Docking to Left keeps the report aligned to the left side, which works well for data-entry oriented departmental reports.
Configure Data Input Screen
Name data area, define variables, set up formulas and filtering
Review the three naming rules. The illustration shows where to place the table name in the top-left corner of the table1 area.
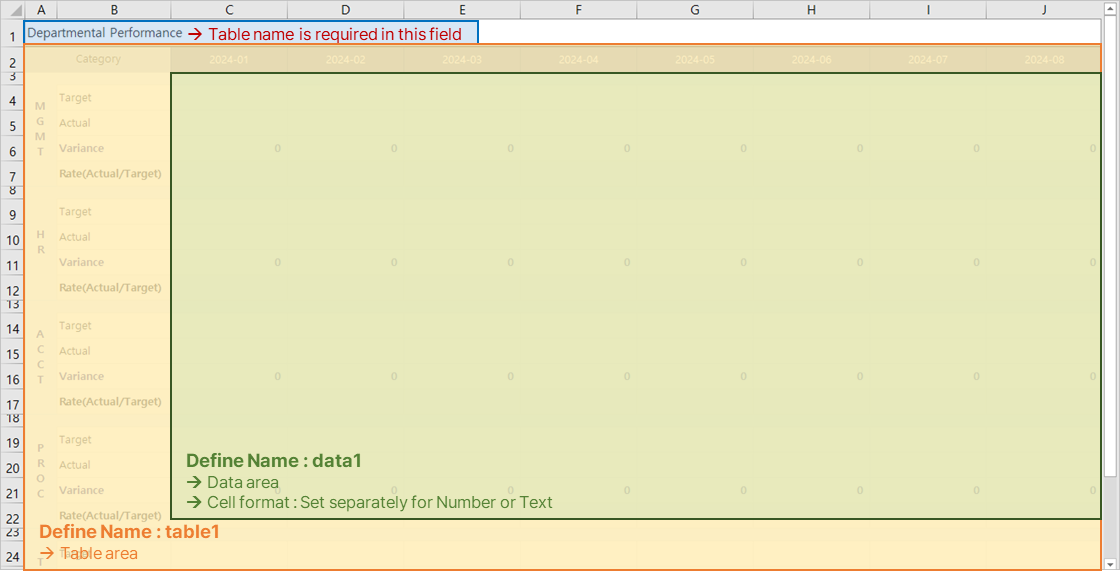
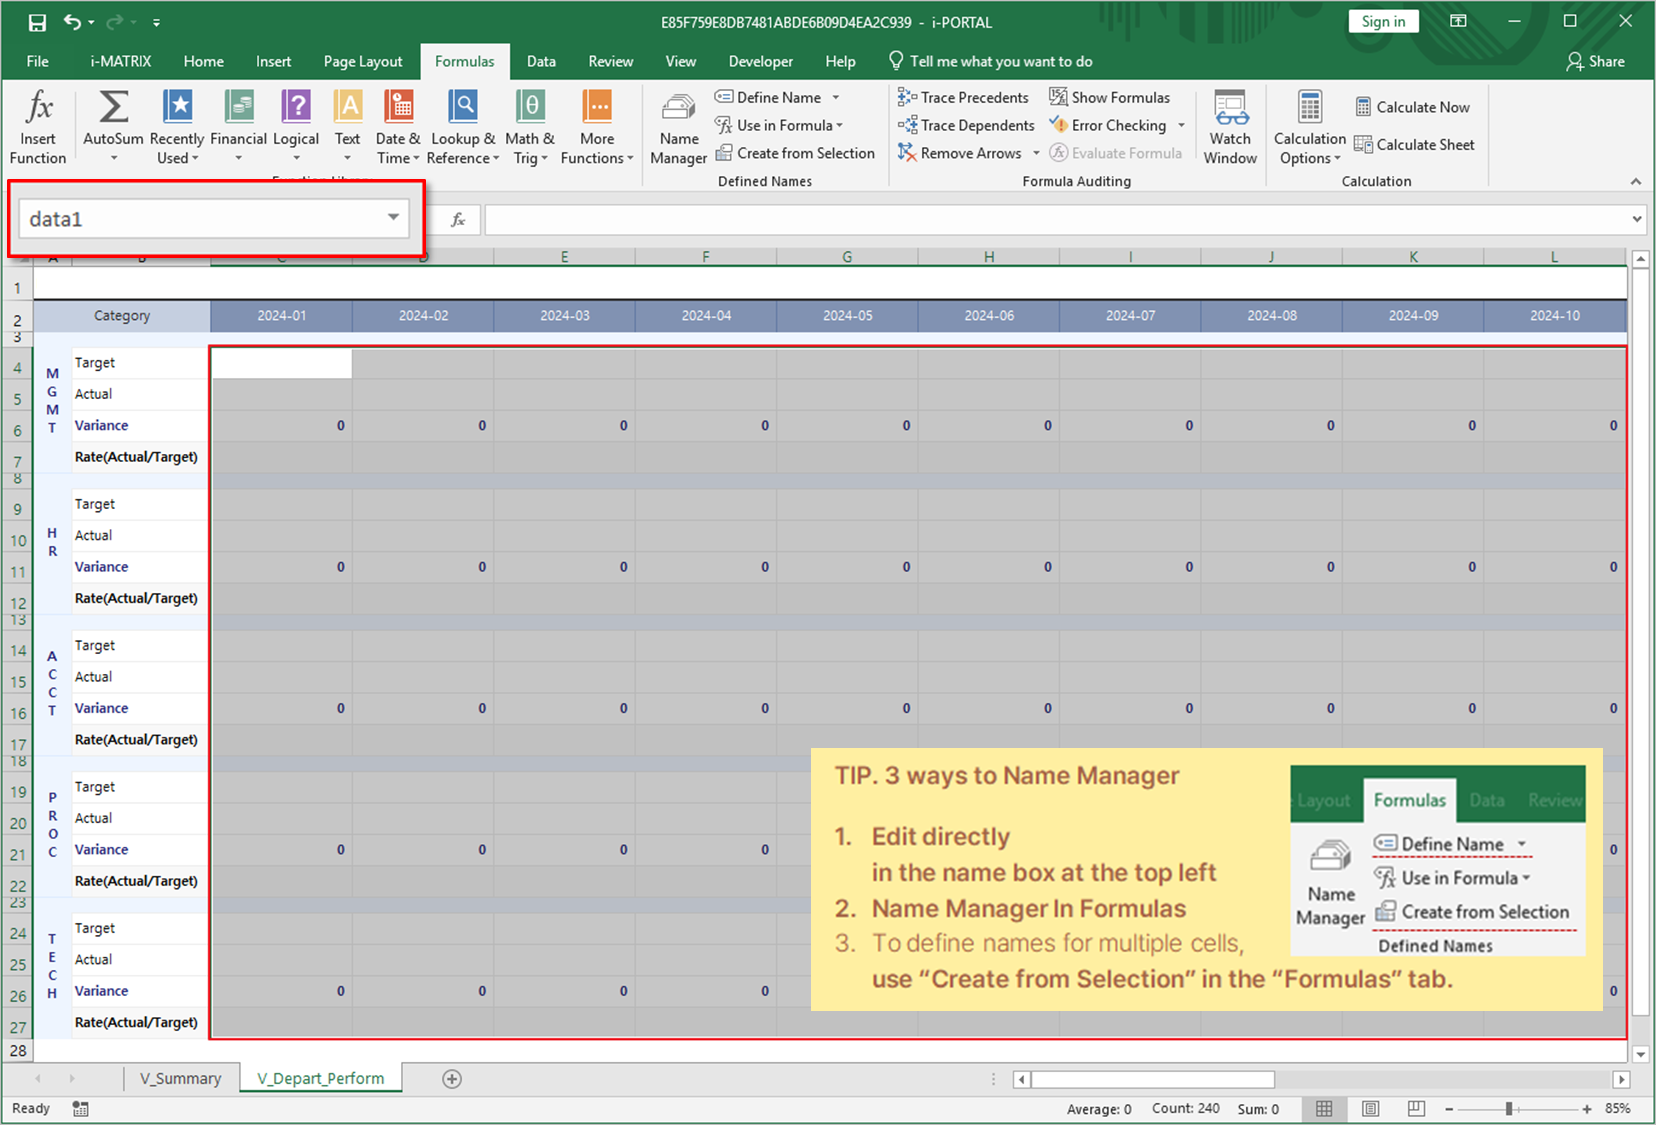
Select and name the data entry area as data1.
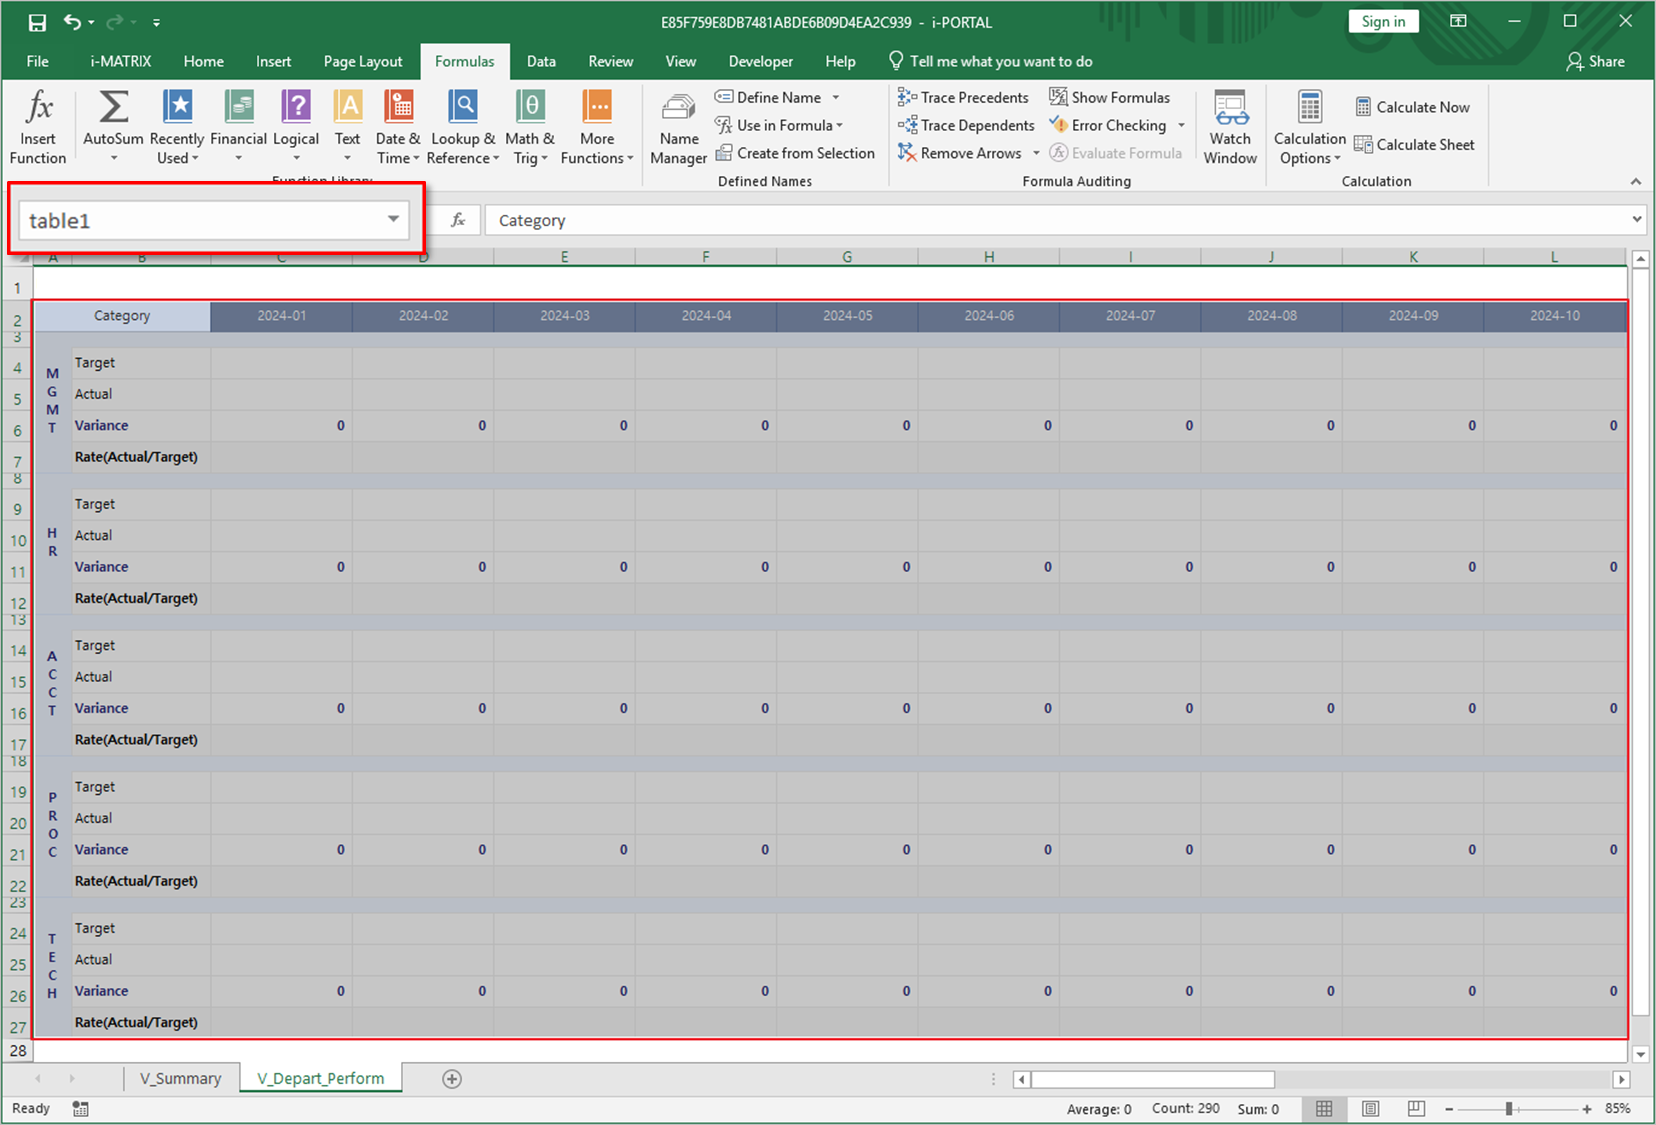
Select the entire table form and name it as table1 for aggregation.
Enter the table name in the top-left corner cell of the table.
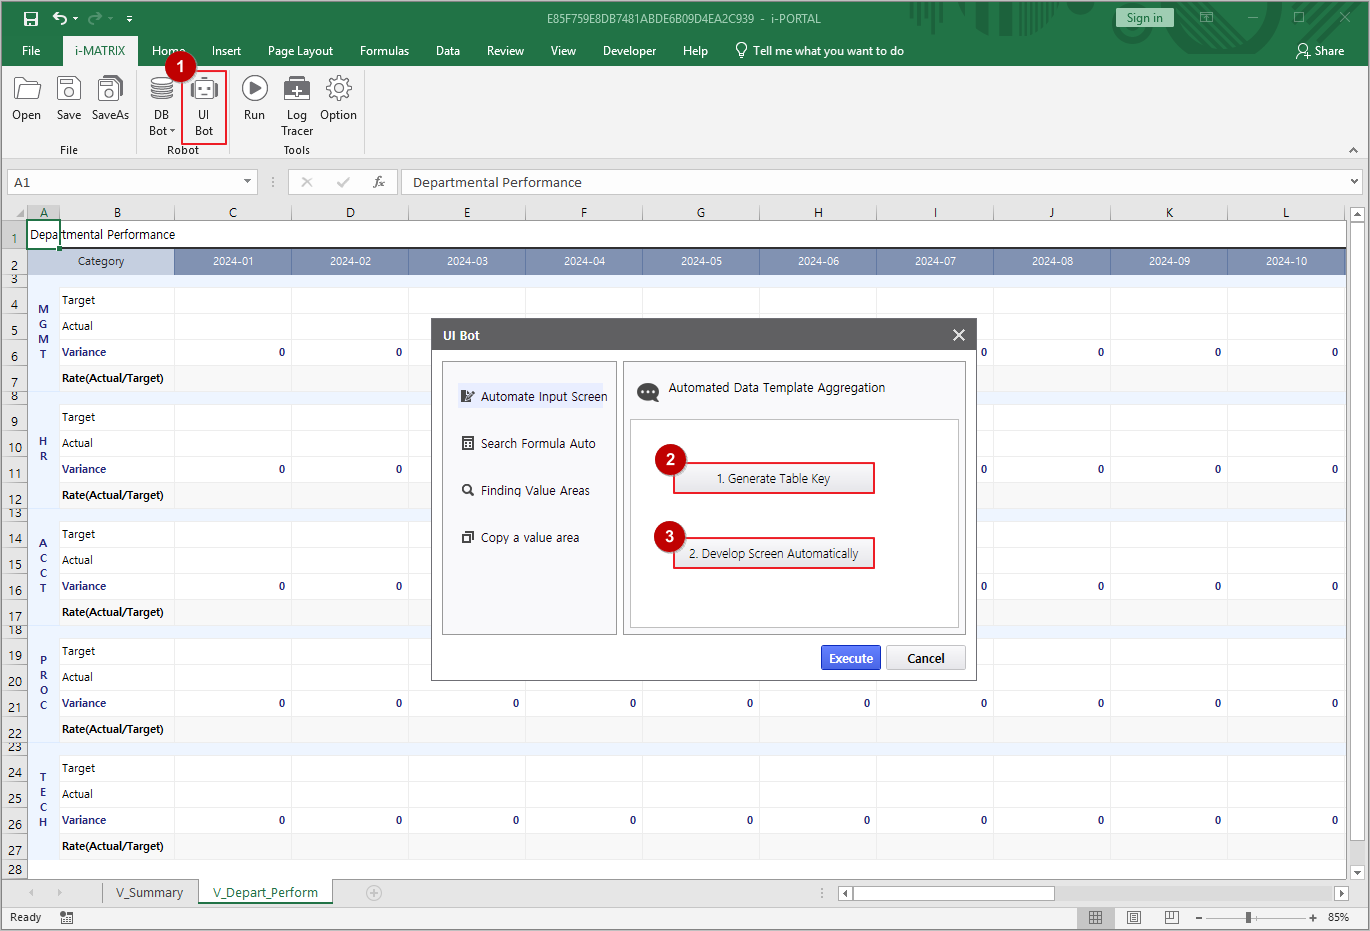
Launch UI Bot from the i-MATRIX ribbon to begin configuring UI components.
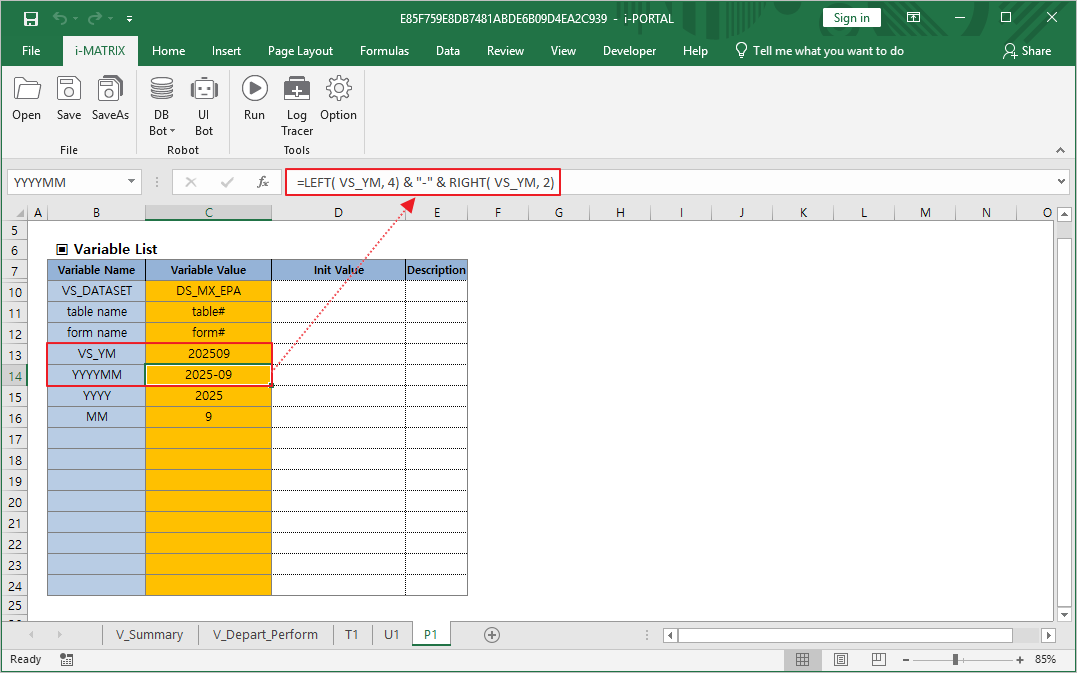
Configure the YYYYMM formula for full year-month value.
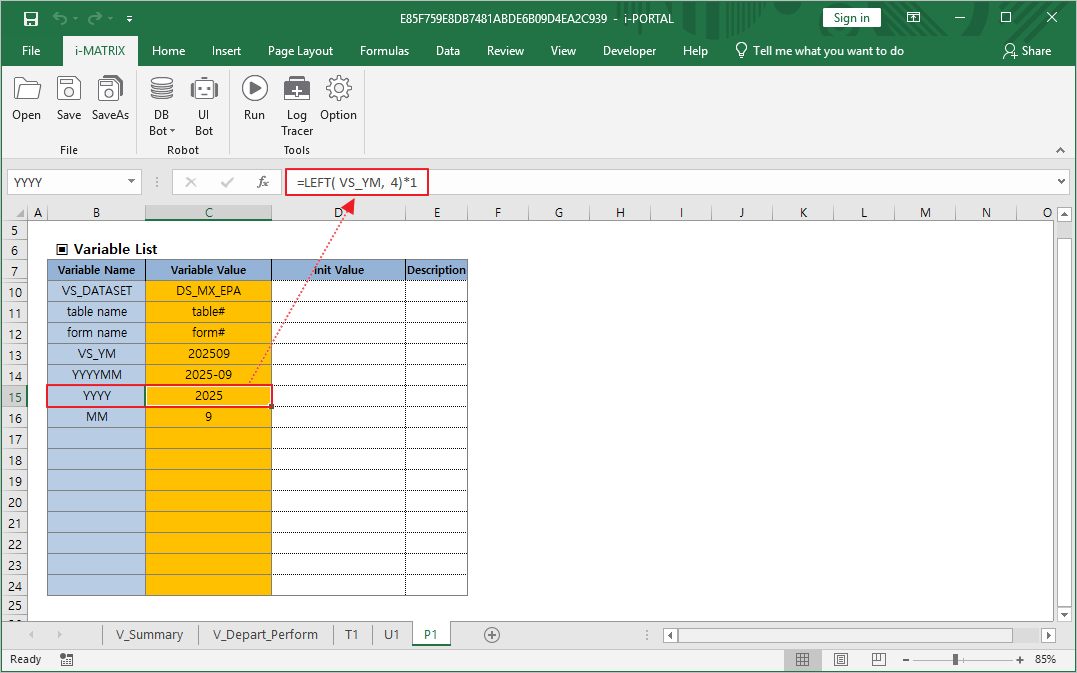
Configure the YYYY formula for year extraction.
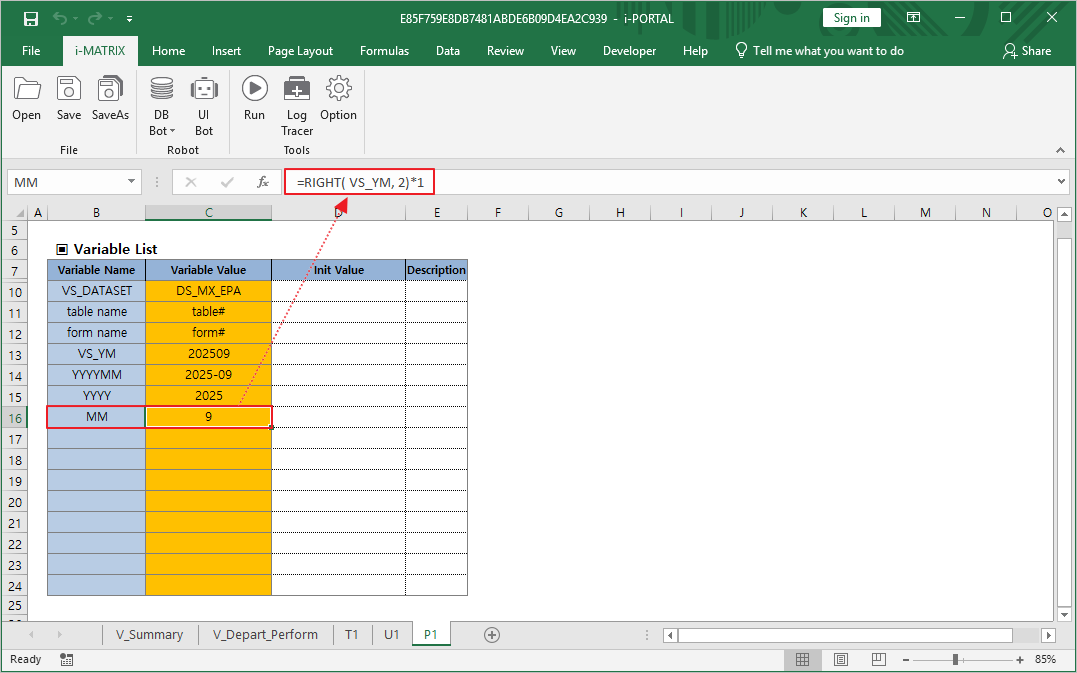
Configure the MM formula for month extraction.
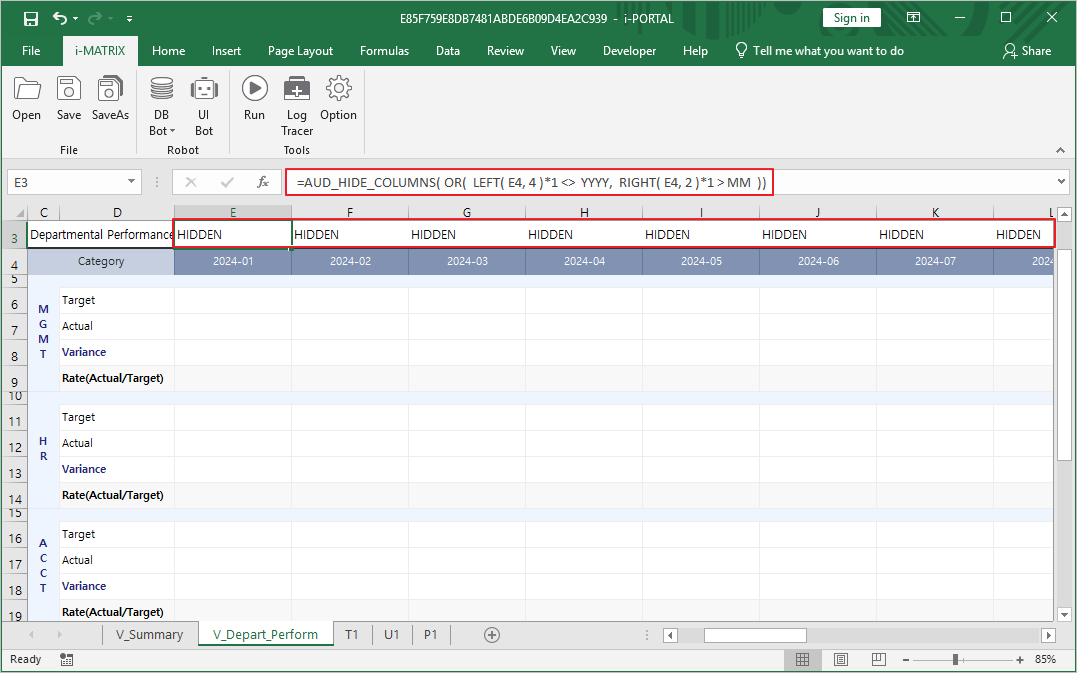
Set up AUD_HIDE_COLUMNS for date-based column filtering.
Tip: AUD_HIDE_COLUMNS dynamically hides columns that are not relevant to the selected period, keeping the report clean and focused.
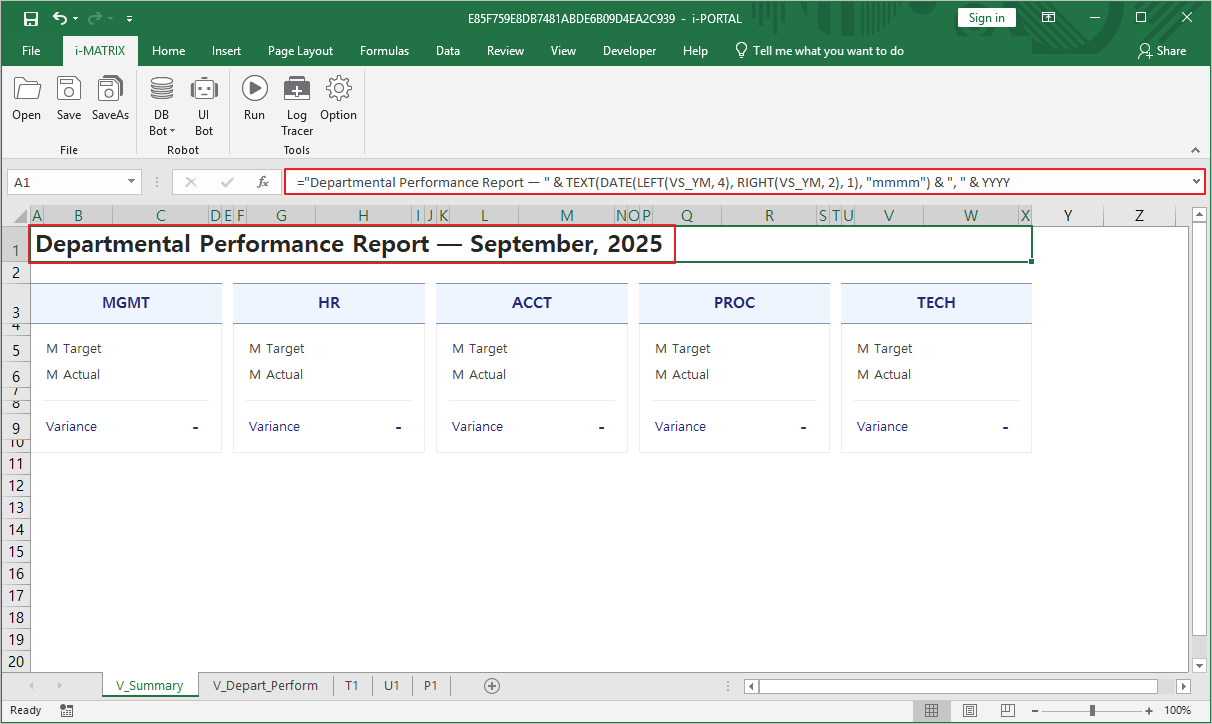
Configure the display title formula on the V_Summary sheet.
Connect Database & Buttons
Set up database upload, MXGrid, and action buttons
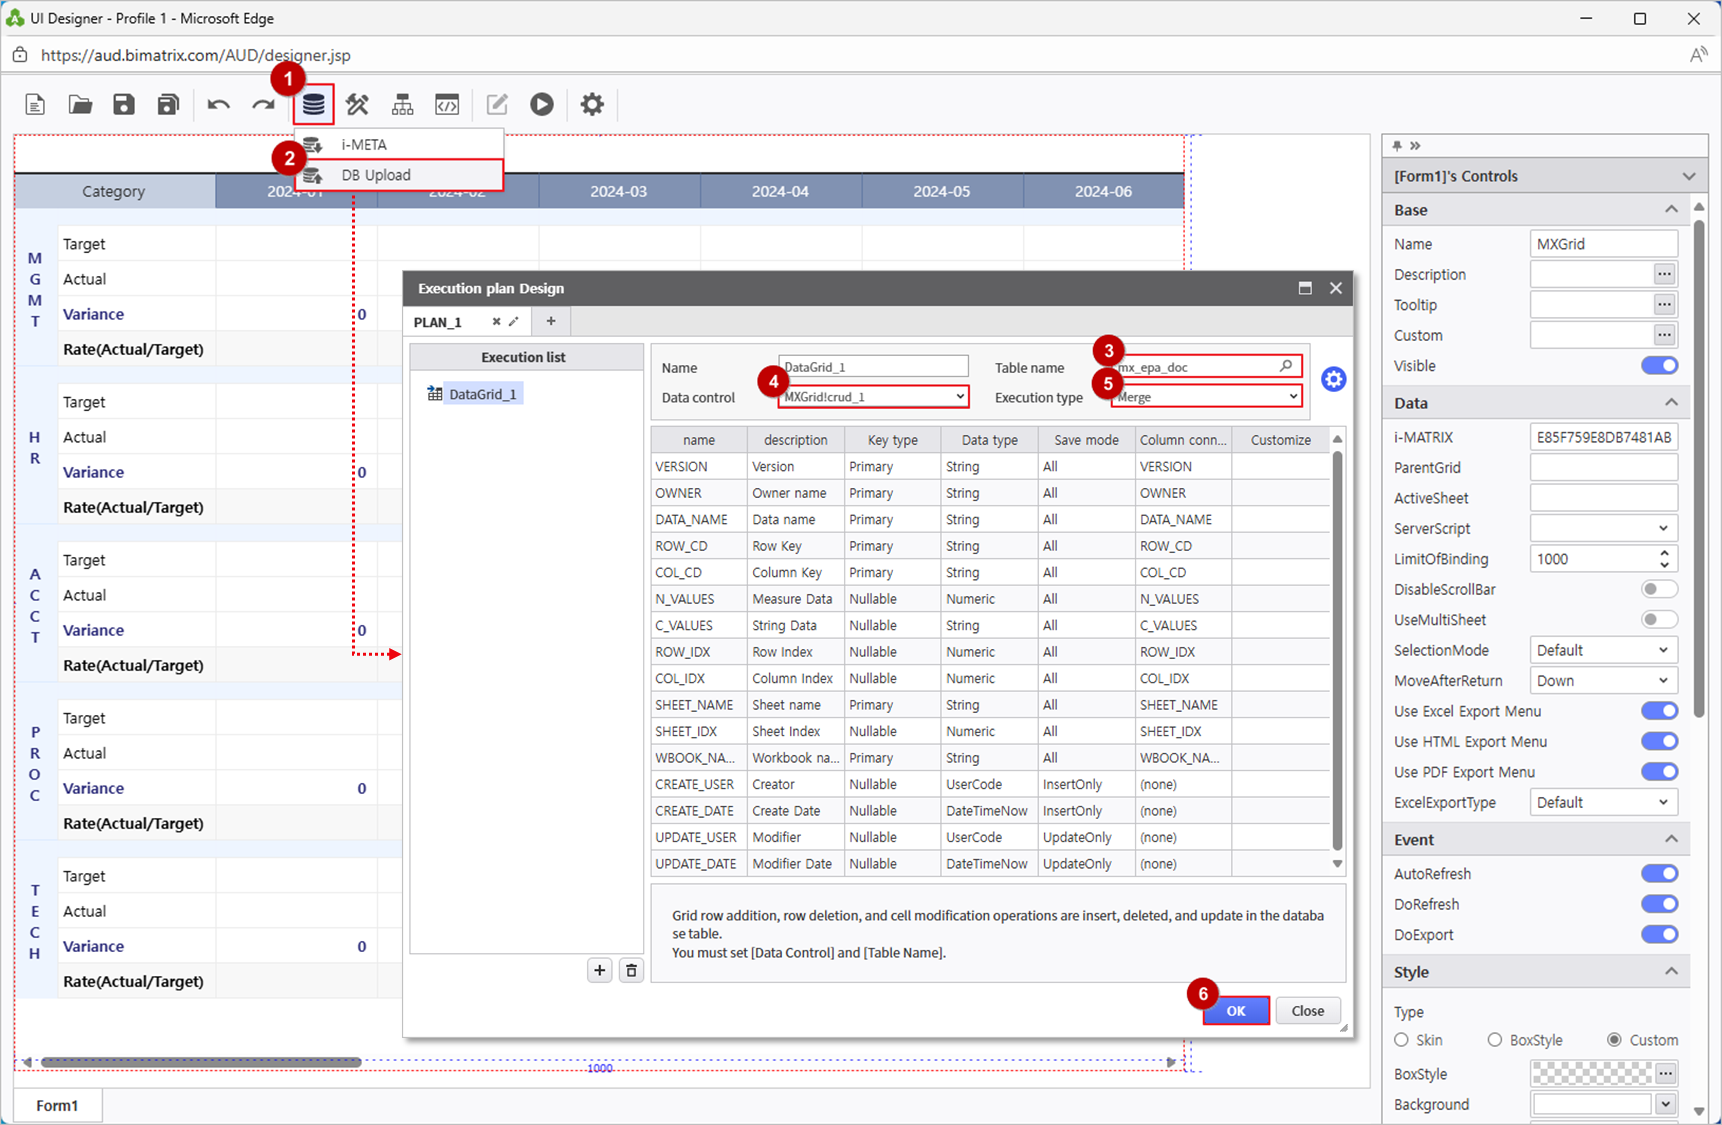
Open DB Bot → DB Upload to configure database connectivity.
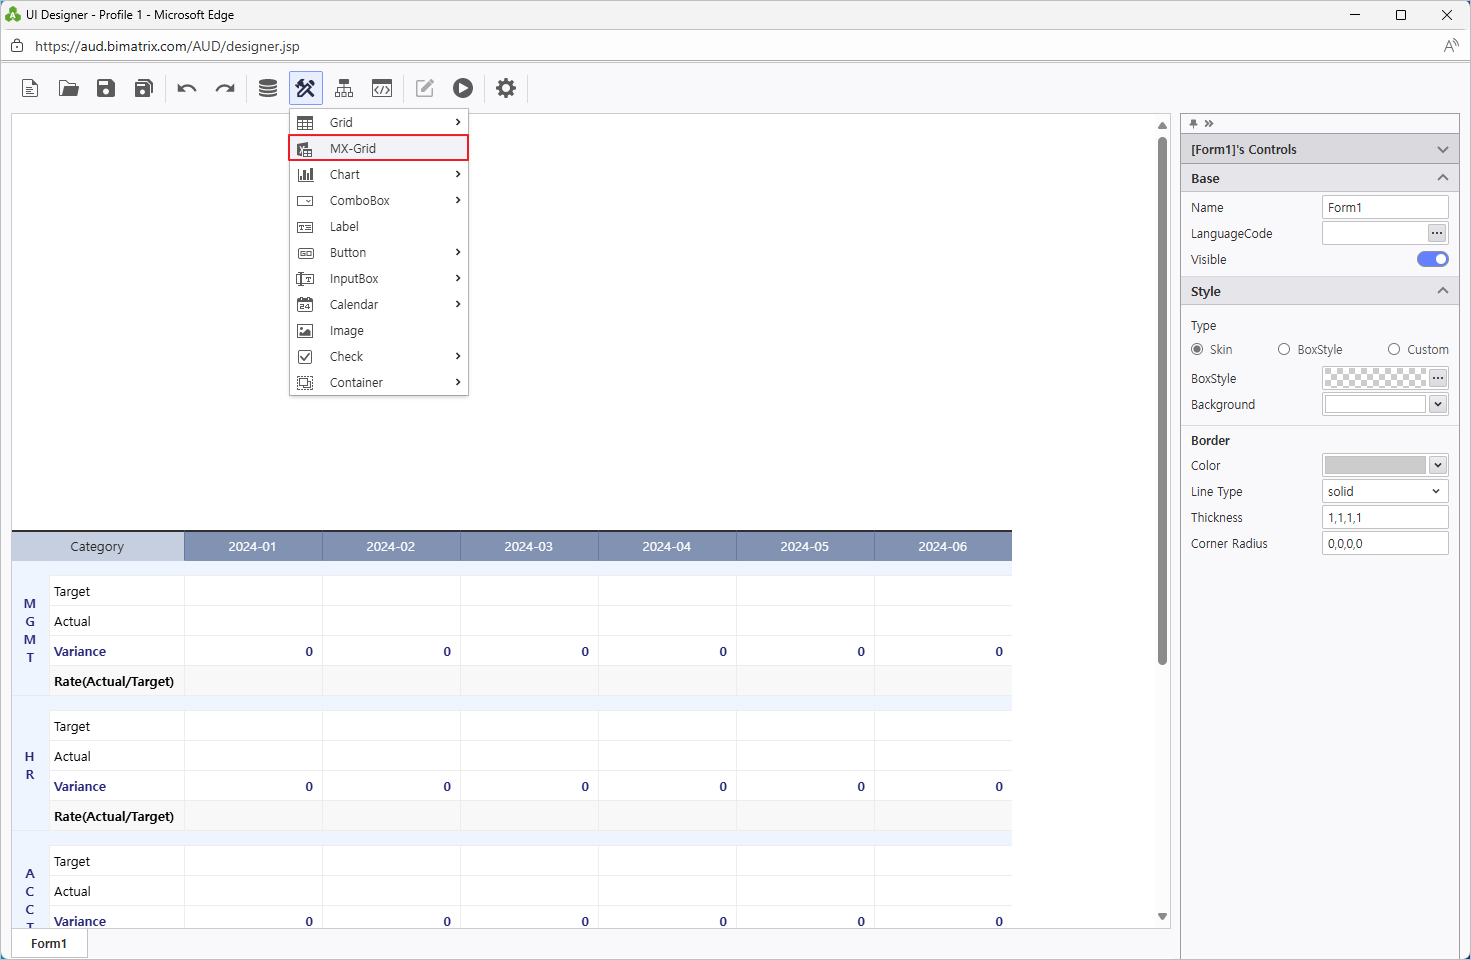
Add an MXGrid component from UI Bot.
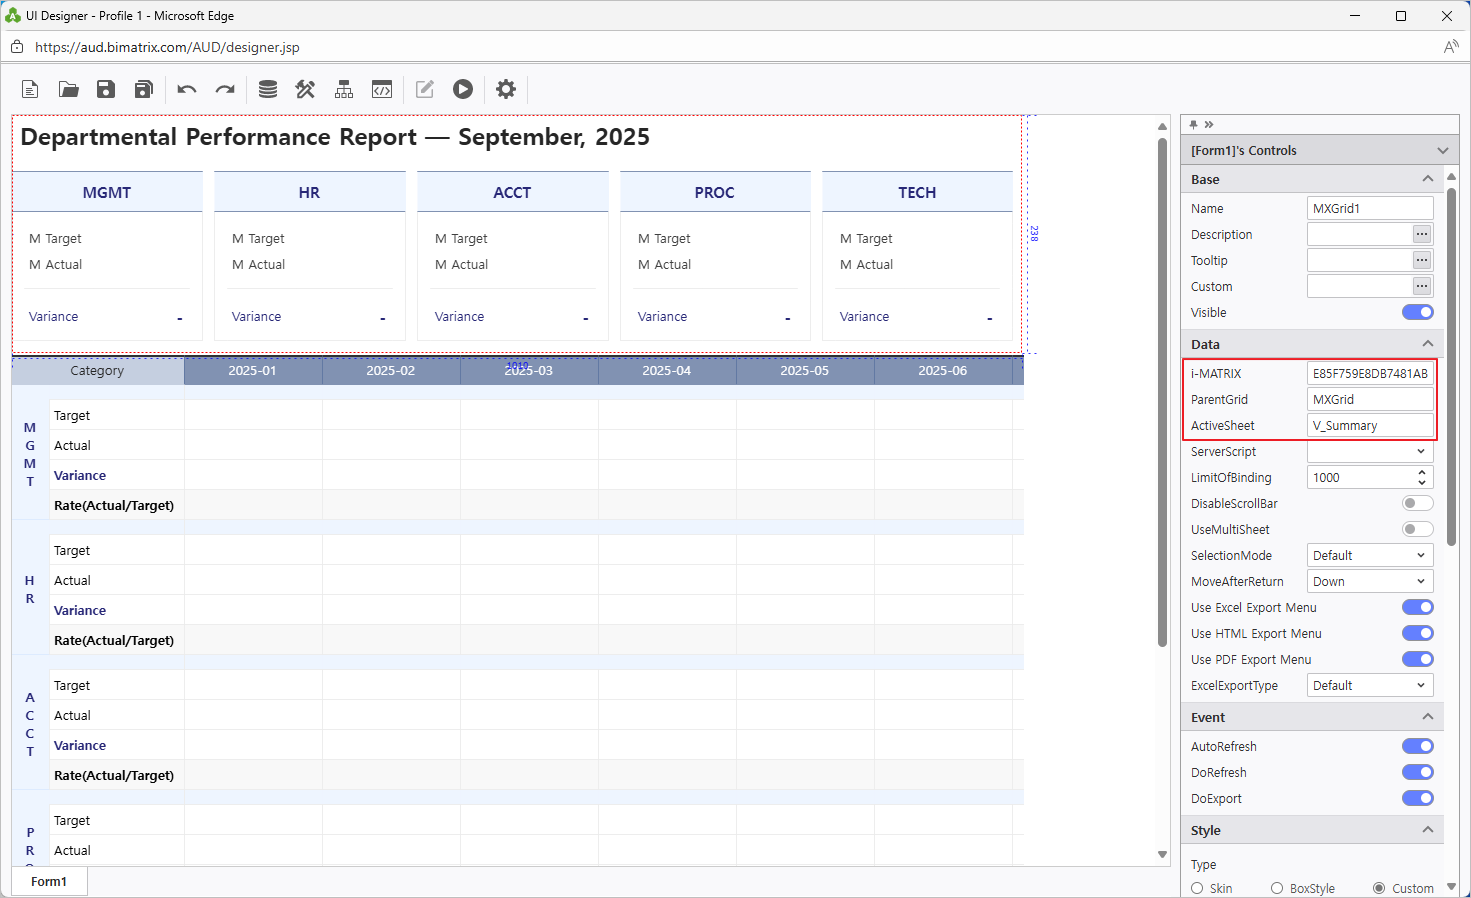
Configure MXGrid1 with the V_Summary sheet.
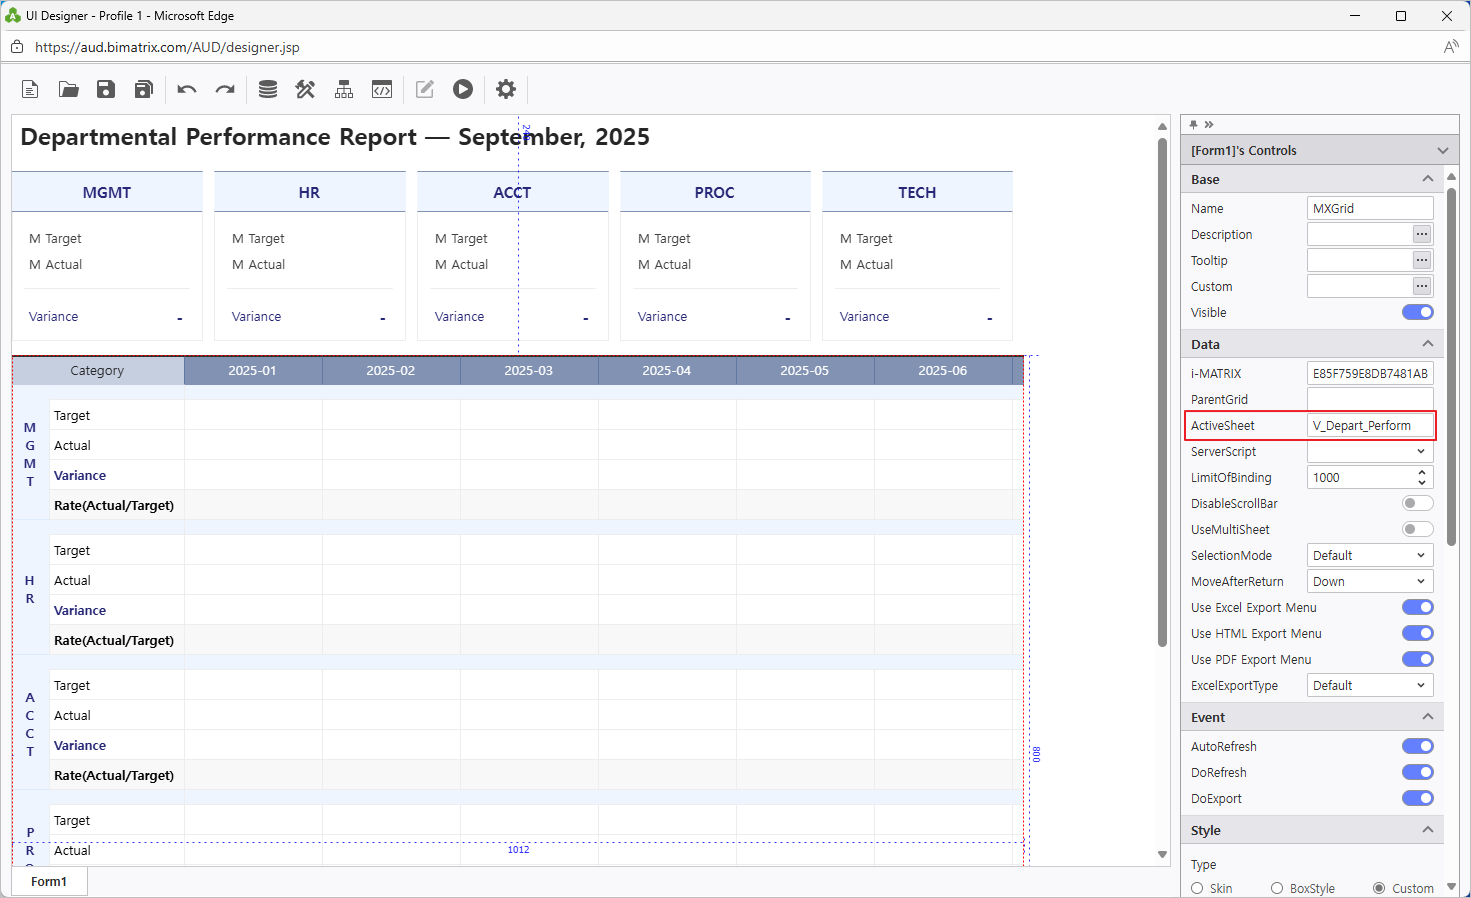
Configure MXGrid with the V_Depart_Perform sheet.
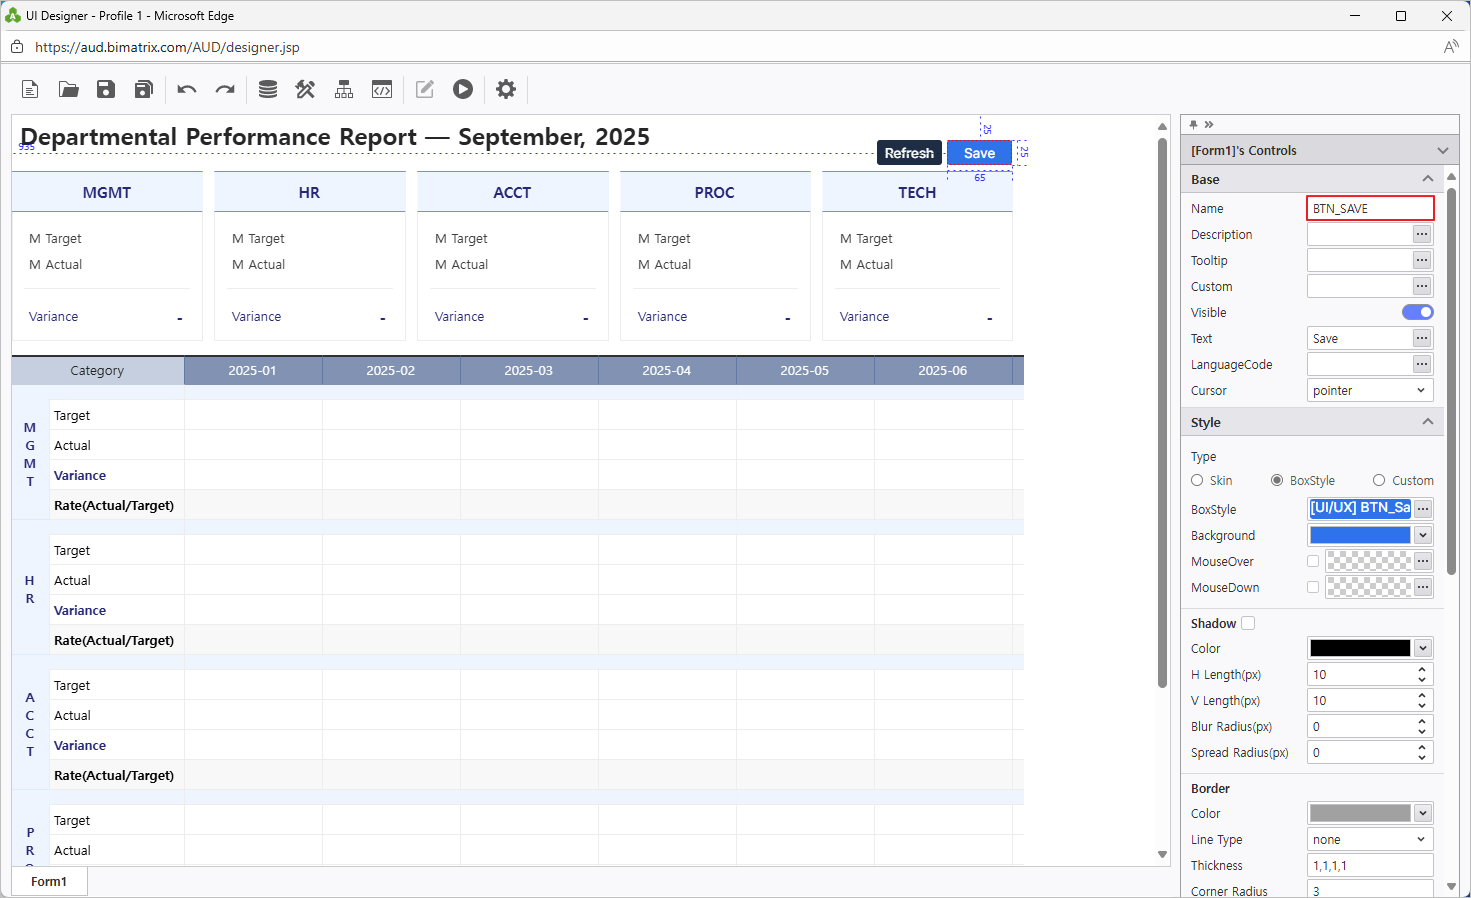
Name the Save and Refresh buttons.
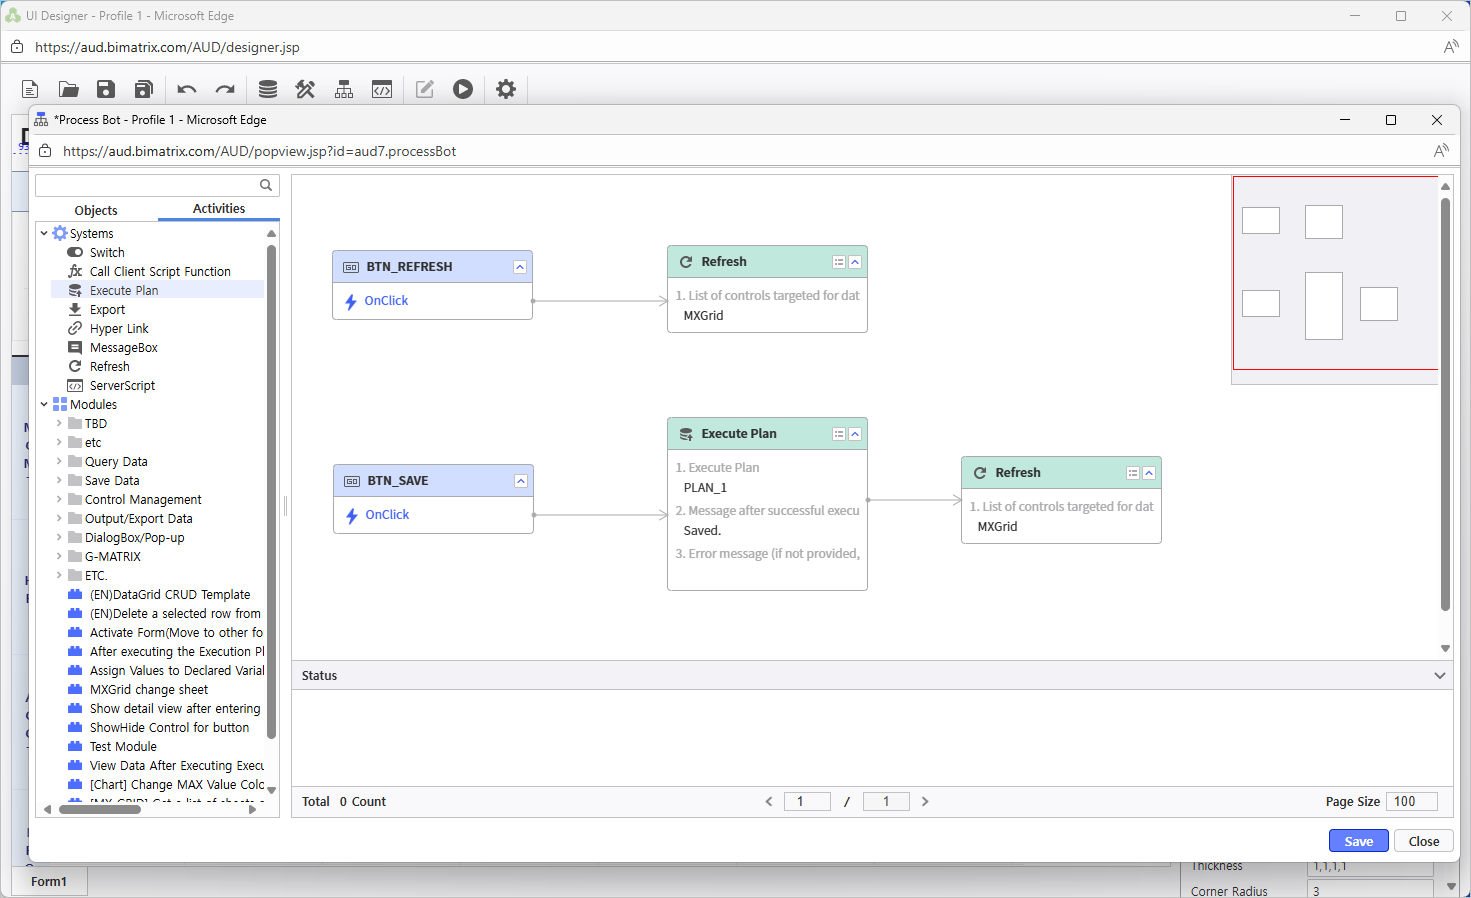
Assign button actions via Process Bot to connect Save and Refresh to their respective operations.
Add a Month Calendar control linked to the VS_YM variable for month-year selection.
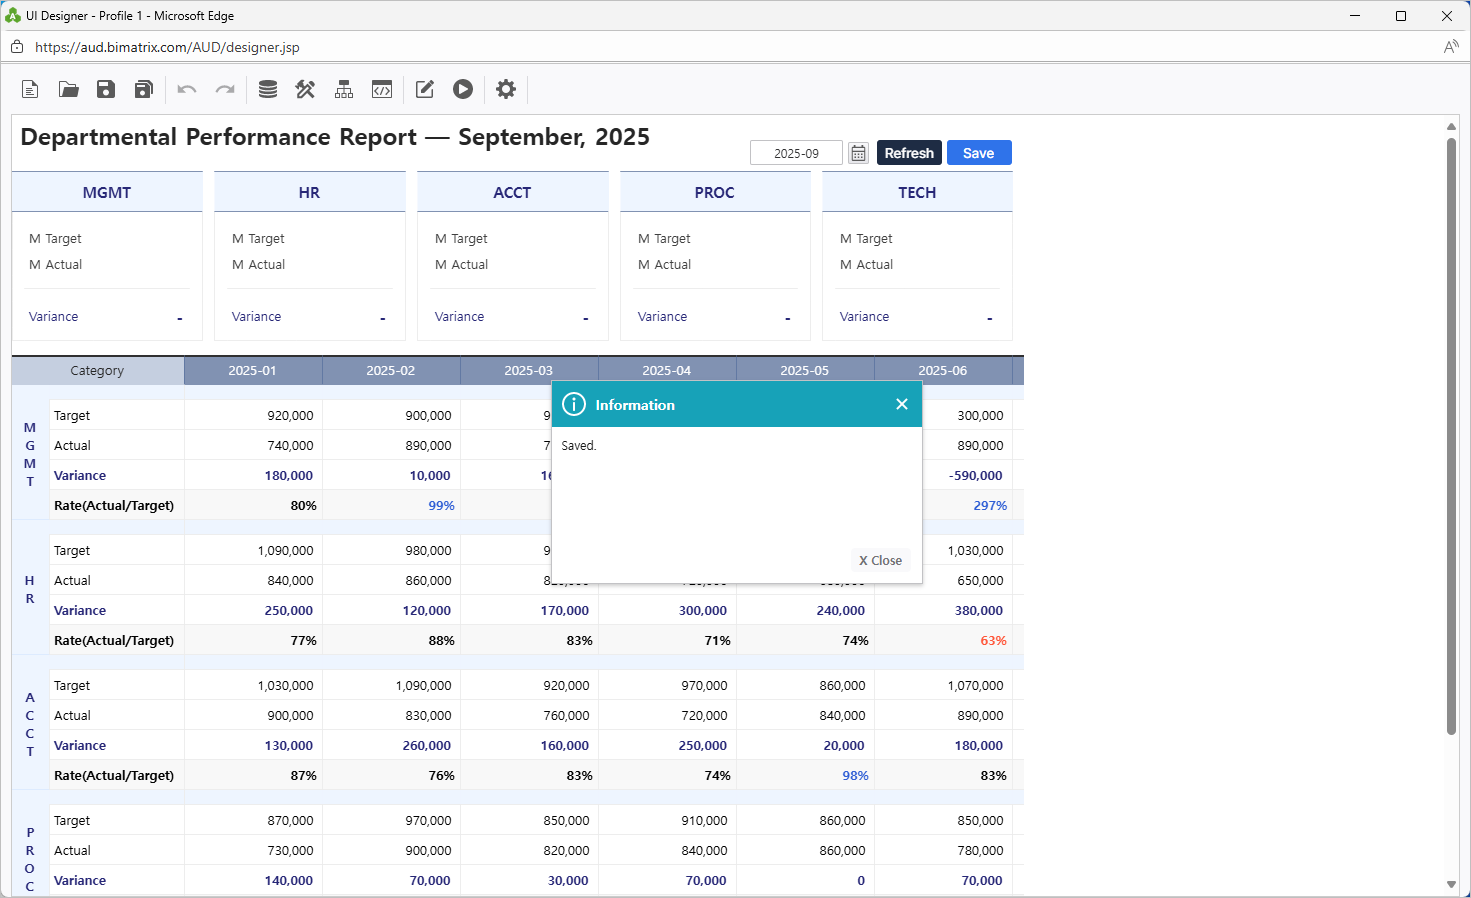
Verify Save and Refresh functionality to confirm everything works correctly.
Tip: The Month Calendar + Refresh button combination allows department managers to switch between periods and view updated performance data instantly.
Save Your Report
Save to My Folder and verify your report is accessible
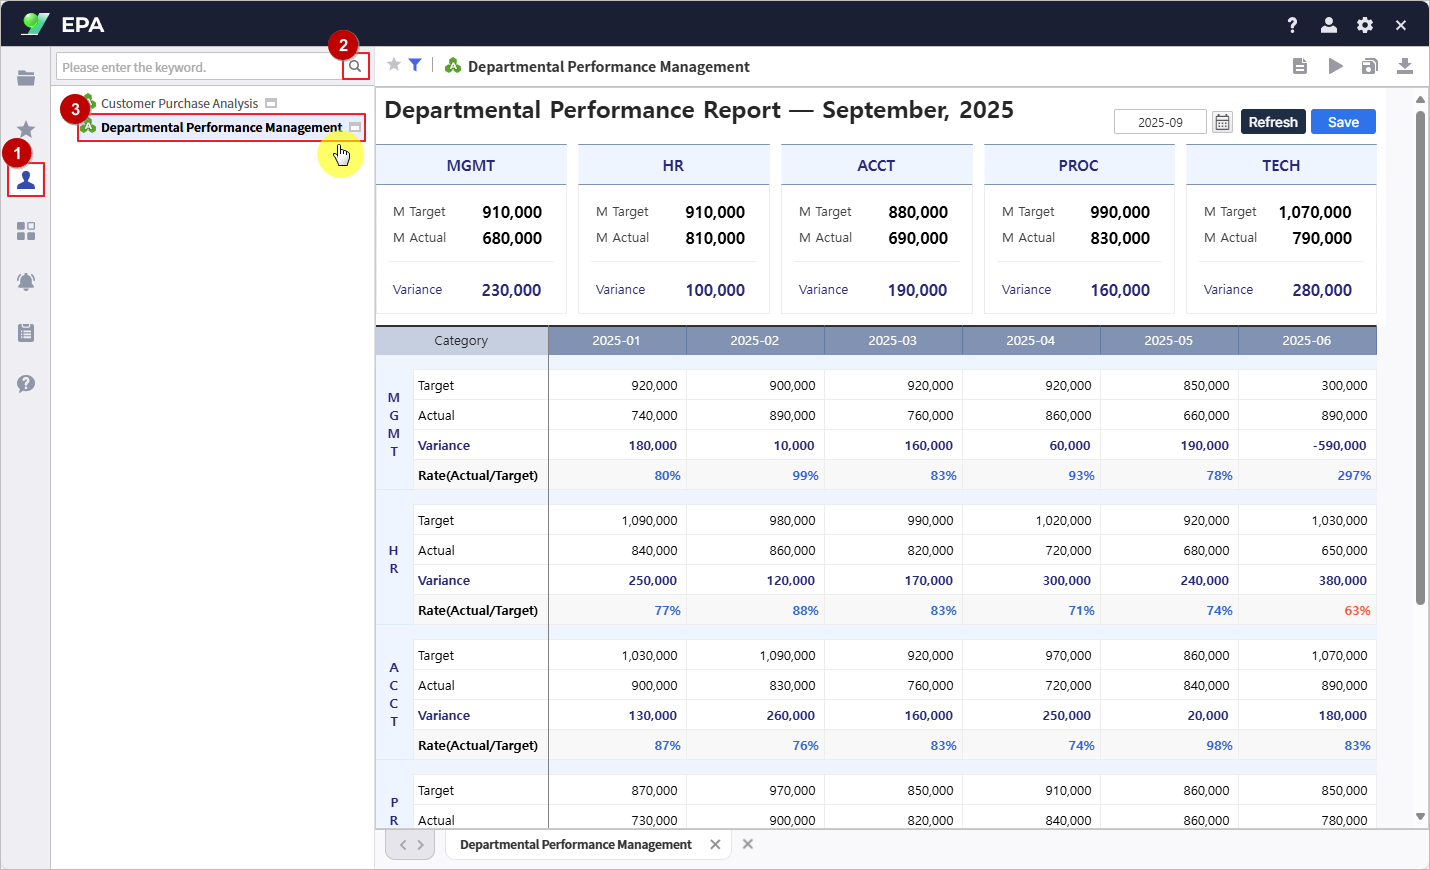
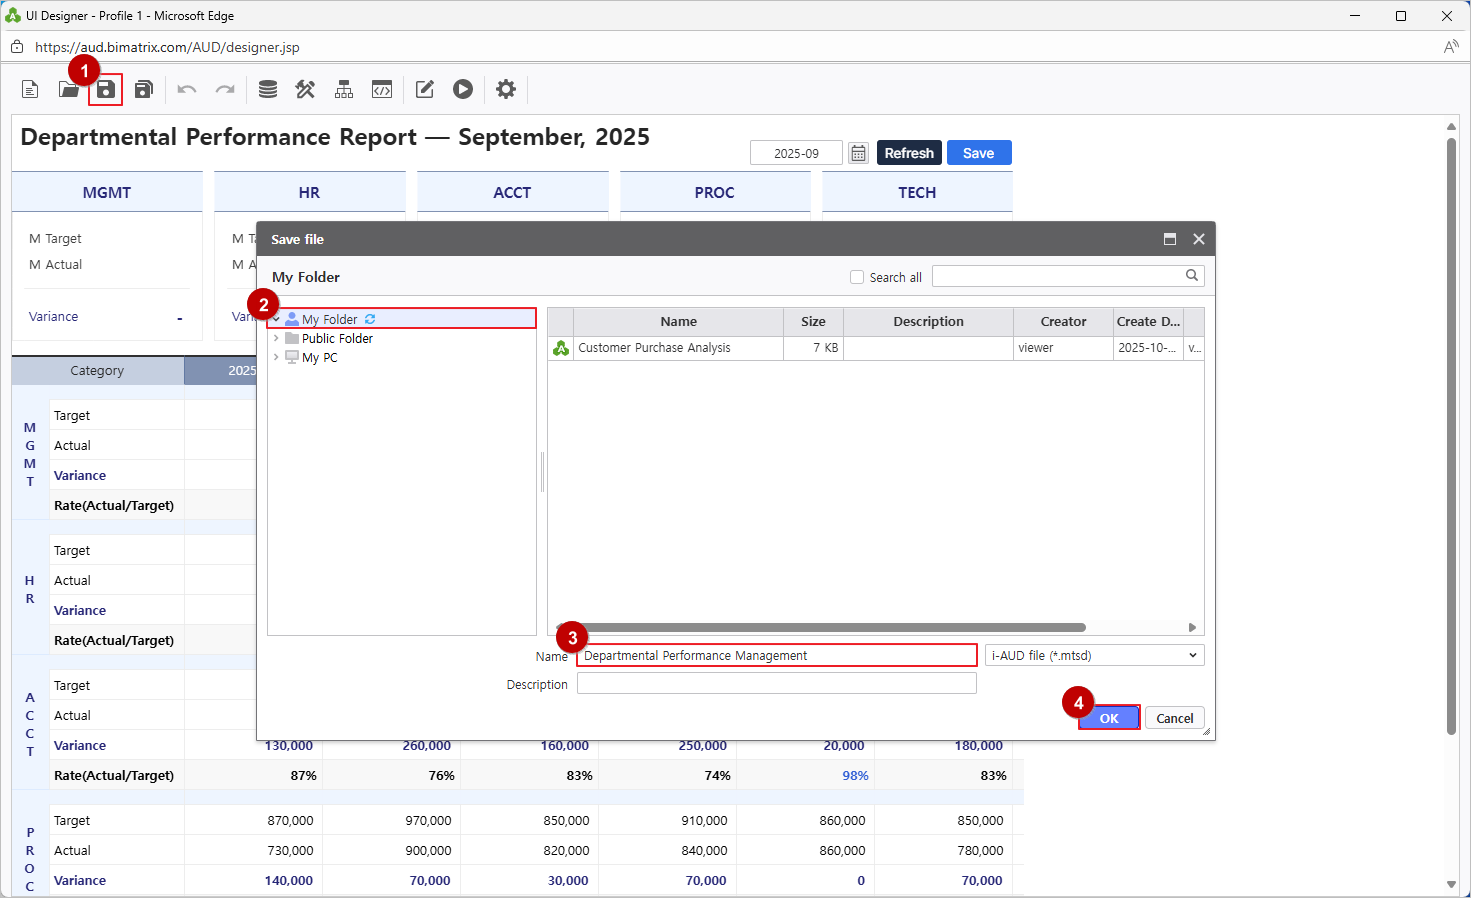
Save your completed report to My Folder.
Verify the report is accessible by navigating to [Menu] → [Individual]. Team members can now input and manage departmental performance data through the web interface.