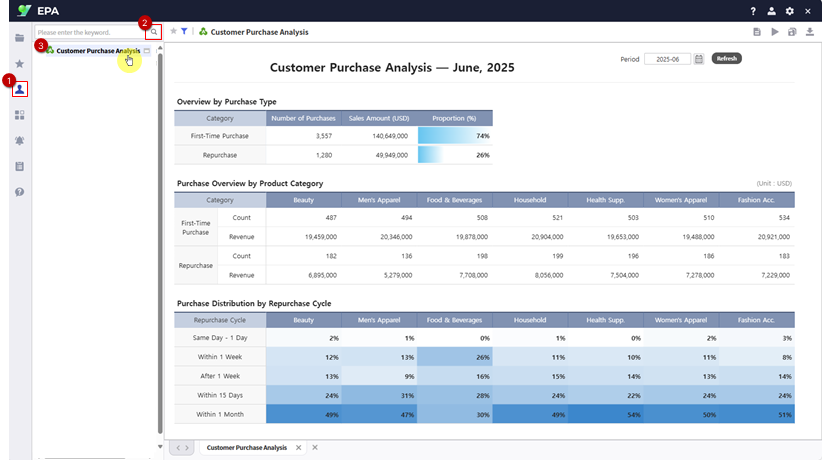
Convert Excel to Web Report
Download sample file and set up the web report environment
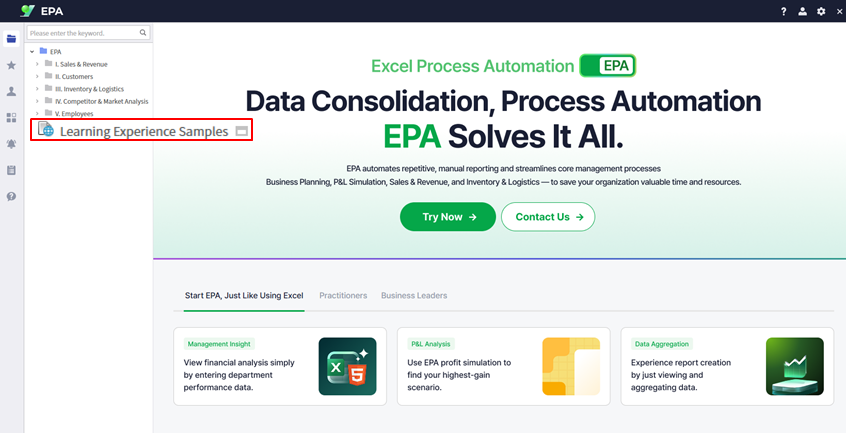
Download the sample Excel file from Learning Experience Samples.
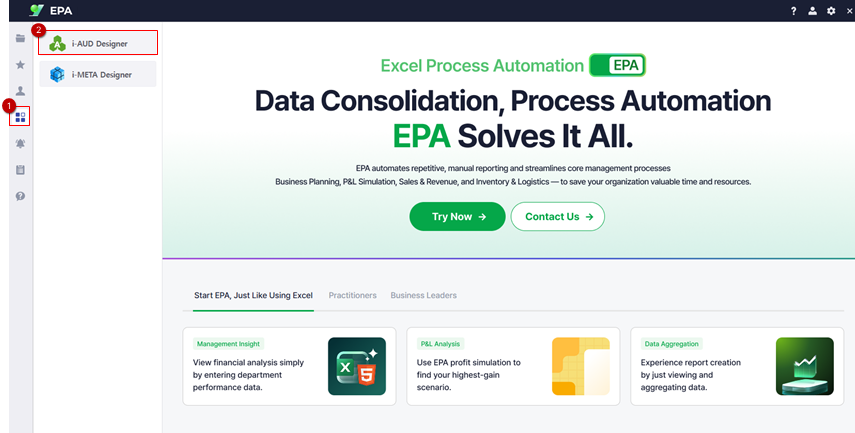
Navigate to [Menu] → [Tool] to open i-AUD Designer.
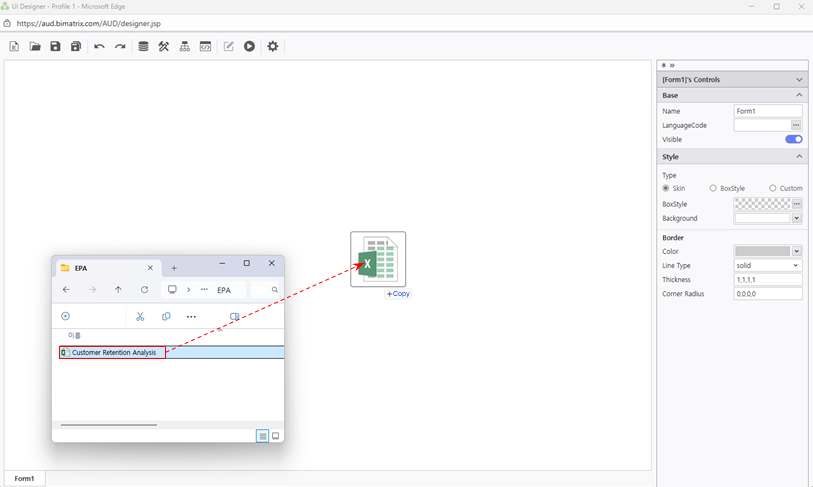
- Drag and drop the Excel file into the Designer workspace
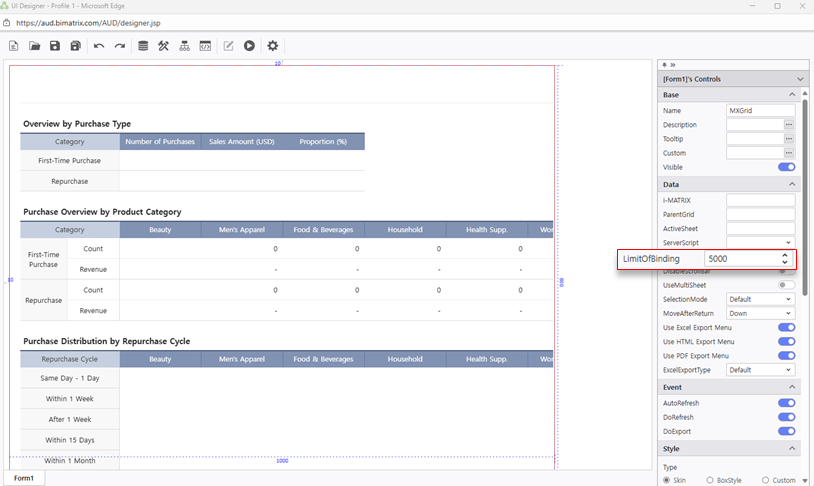
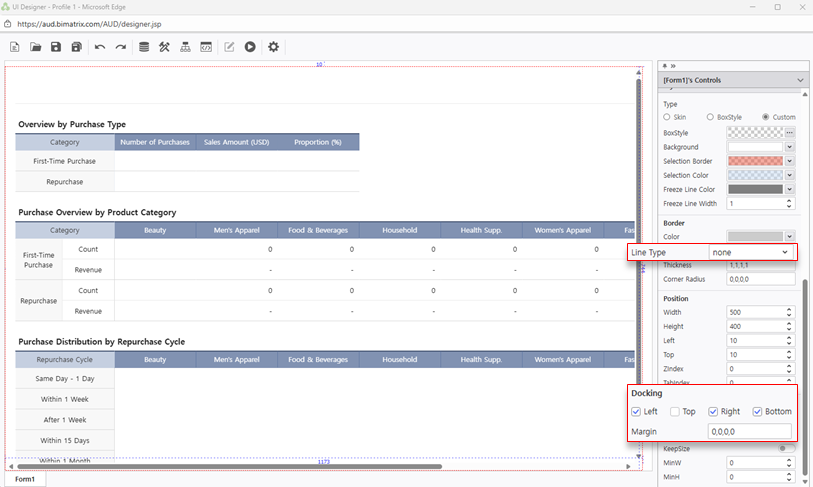
Configure report settings:
- Set
Data > LimitofBinding: 5000to handle large datasets - Configure Docking:
Left,Right,Bottom - Set
Border > Line Type: Nonefor clean presentation
Tip: Setting LimitofBinding to 5000 ensures smooth performance when working with large customer datasets (default is 1,000).
Database Connection (Variables)
Set up the V/D/P sheet structure for data management
Configure the three-sheet structure that separates concerns:
- V Sheet
V_Retention— the display/visualization layer
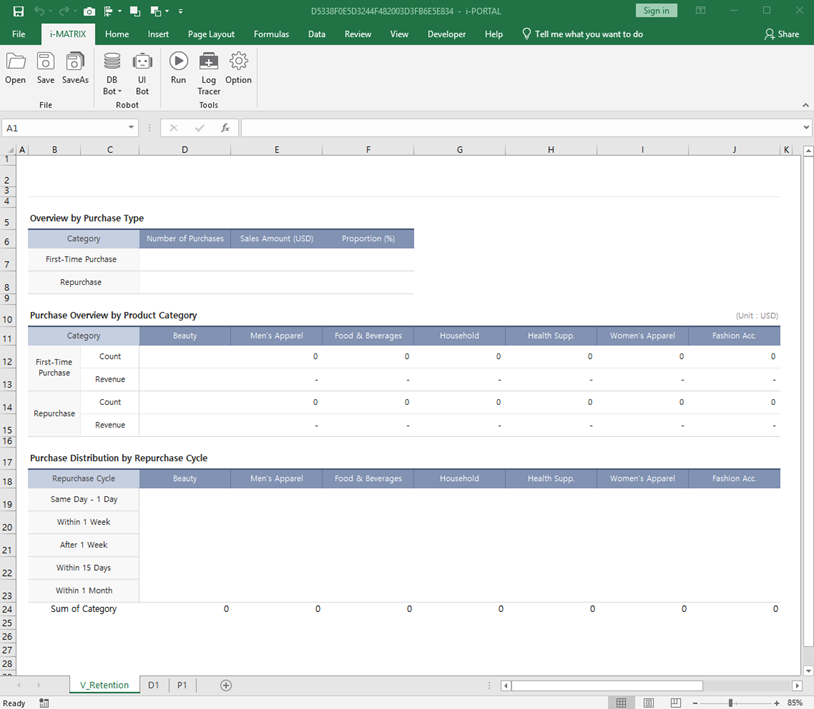
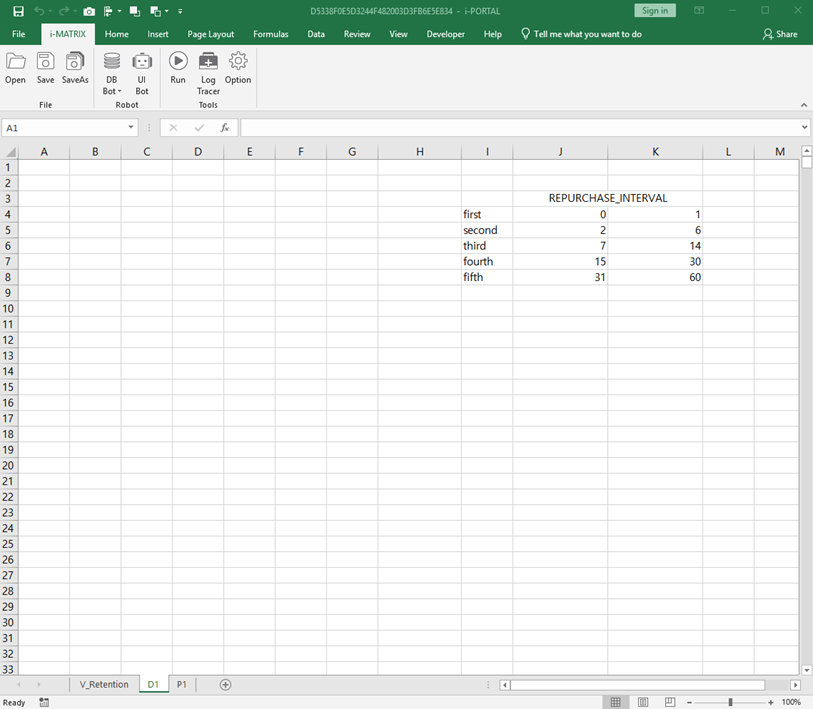
- D Sheet
D1— raw data storage and retrieval
- P Sheet
P1— parameter variables (e.g.,YearMonthfor date filtering)
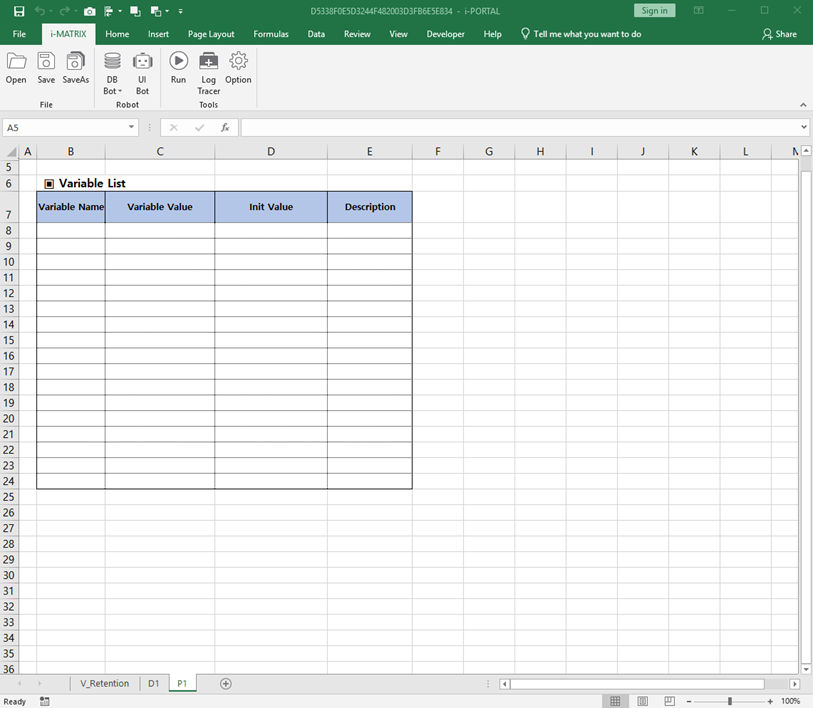
Review the Excel sheet naming convention to understand the V/D/P structure.
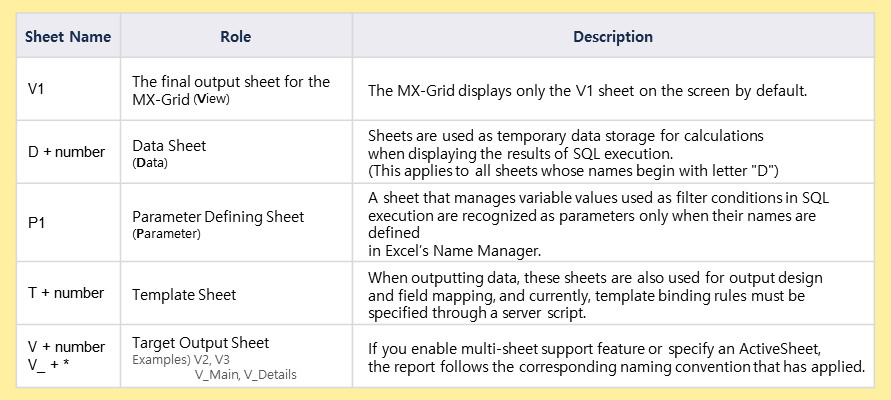
Tip: The V/D/P structure separates concerns: V for visualization, D for data, and P for parameters. This makes reports maintainable and flexible.
Define Variables & Retrieve Data
Create named variables and configure SQL data retrieval
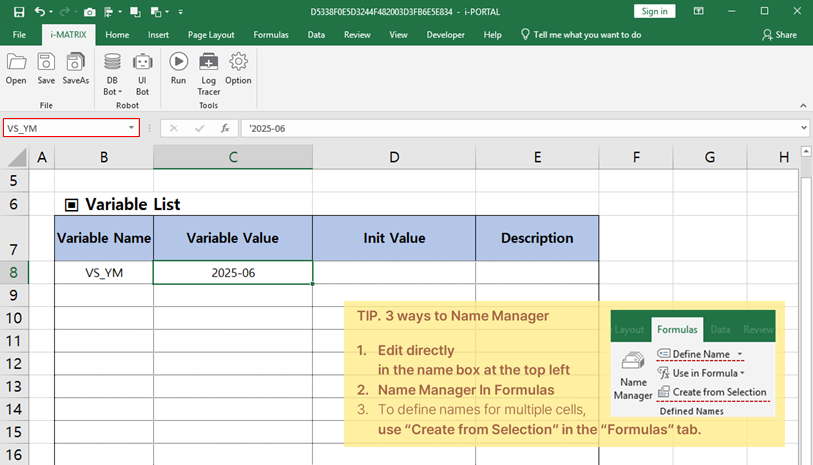
Open Name Manager and define the YearMonth variable in the P sheet. Enter values like "2025-06" with a leading apostrophe to preserve text format.
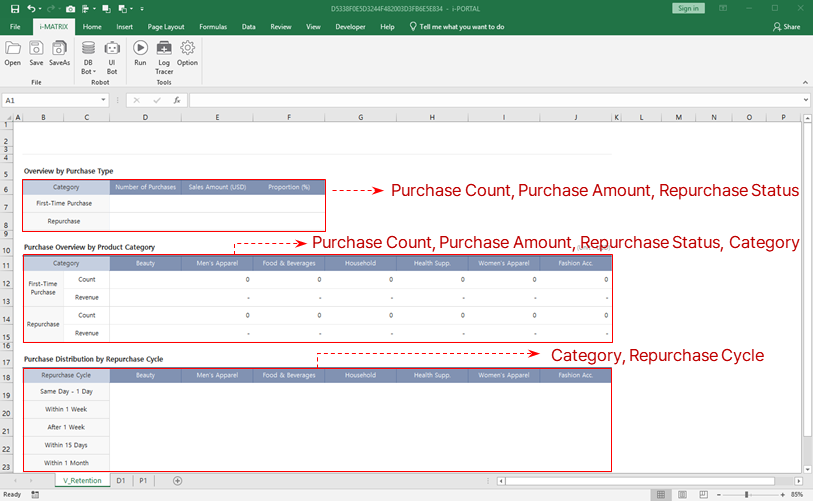
Identify the columns required to create the V sheet for the retention analysis display.
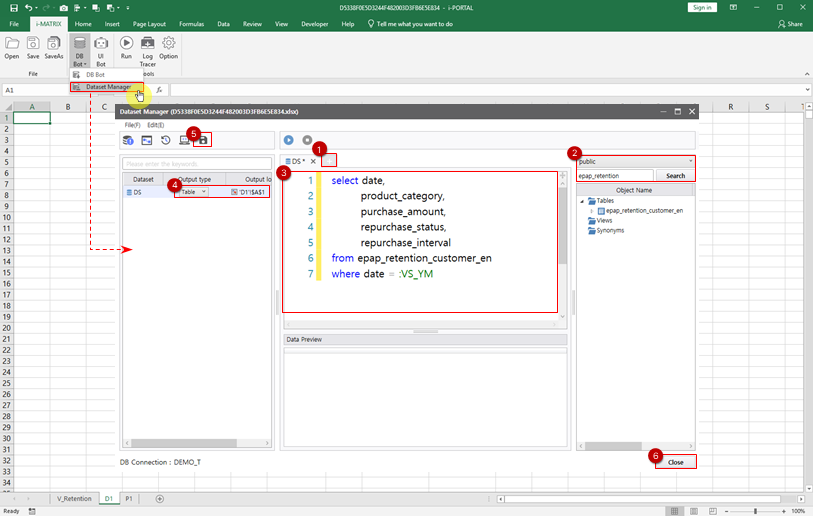
Configure SQL data retrieval:
- Navigate to
i-MATRIX > DB Bot > Dataset Manager - Add your database connection and configure the SQL query
- Write the SQL query with the date filter:
WHERE date = :VS_YM - Set output to D1 sheet as Table format
Tip: The :VS_YM syntax binds the variable to the SQL query, enabling dynamic date-based filtering at runtime.
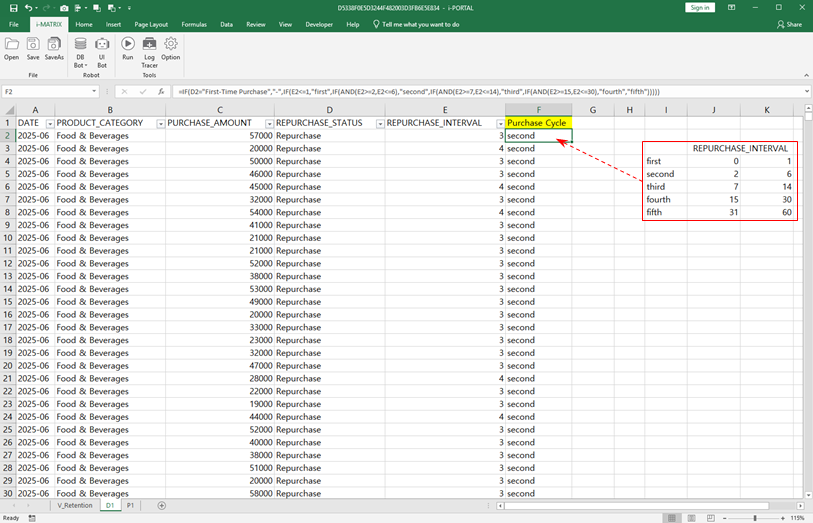
Apply the Purchase Cycle formula to calculate customer retention metrics and auto-fill the results.
Connect Data to V Sheet
Link retrieved data to the visualization sheet with formulas
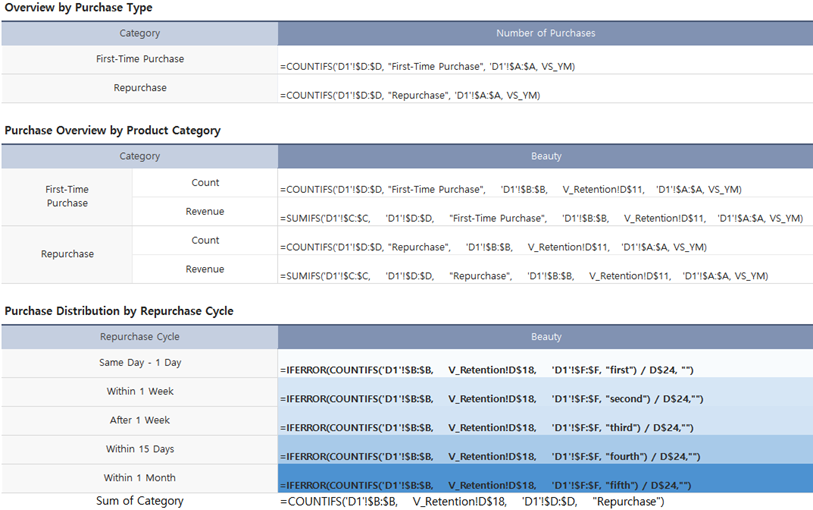
Use aggregation formulas to connect data from the D sheet to the V sheet:
- Apply
COUNTIFSformula to calculate purchase counts per customer segment - Apply
SUMIFSformula to aggregate revenue data by category
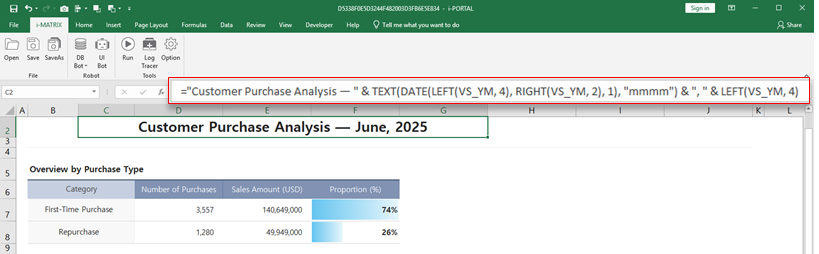
- Create a dynamic title formula that updates based on the selected date period
- Hide unnecessary rows and save the file
Tip: COUNTIFS and SUMIFS are powerful for aggregating customer data across multiple criteria, making retention analysis straightforward.
Configure Search Filter
Add interactive UI elements for filtering by time period
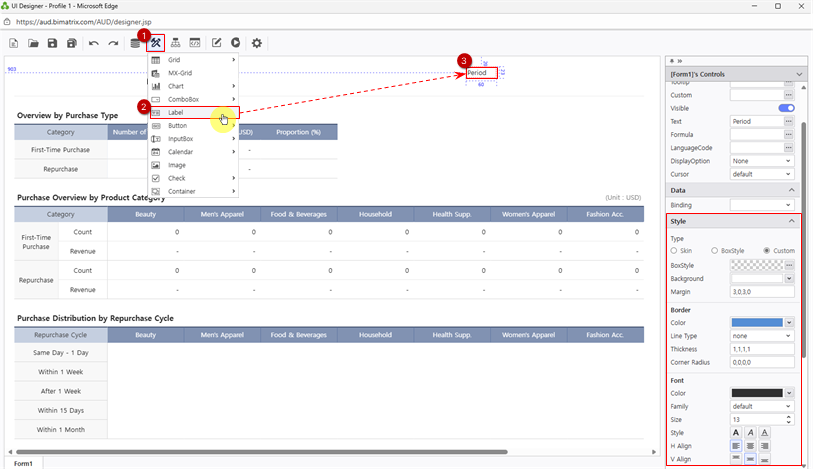
Add a Period Label using UI Bot > Label. Customize font and color in Style properties.
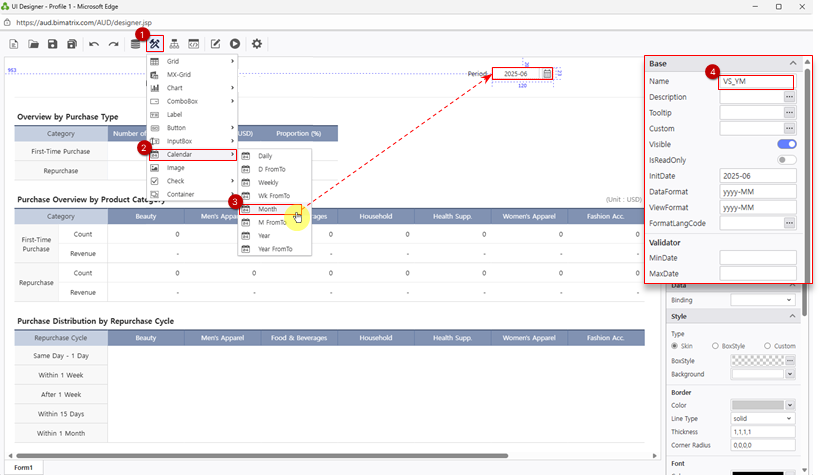
Add a Month Calendar via UI Bot > Calendar > Month:
- Set the Name property to
VS_YM(must match the variable name) - Configure DataFormat:
yyyyMM → yyyy-MM
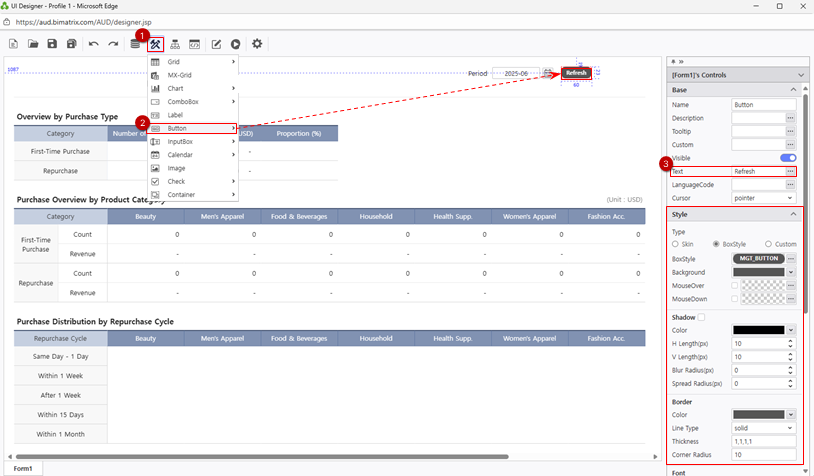
Add a Refresh Button via UI Bot > Button. Apply BoxStyle for quick formatting.
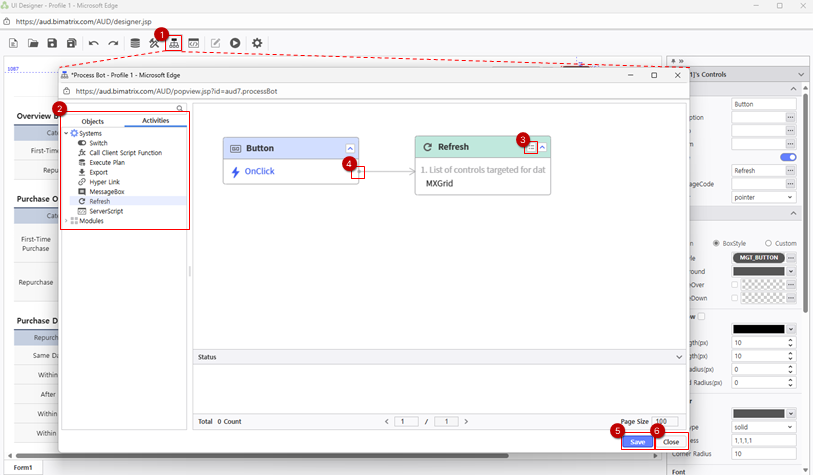
Configure button event using Process Bot:
- Connect button click → Refresh Module → MXGrid component
Tip: The Month Calendar linked to VS_YM lets users quickly switch between months without typing dates manually.
Save Your Report
Save and verify your completed retention analysis report
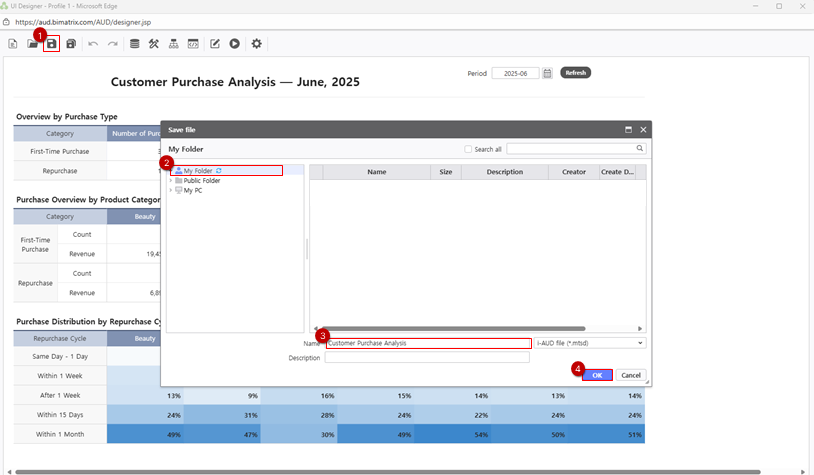
Save your report to your personal folder:
- Click Save and select
My Folderas the destination
Verify your saved report:
- Navigate to
[Menu]→[Individual] - Click the Search button to refresh the list
- Test the interactive filters by changing the month and clicking Refresh